Release Note


-
LogicMonitor Platform
- Introduction to LogicMonitor
- In-App Resources
-
Account Information
- Portal Information
- Portal Settings
- Financial
-
Usage Reporting
- Usage Reporting Overview
-
Product-Specific Usage Reporting
- Usage Reporting for APM Metrics
- Usage Reporting for LM Logs
- Usage Reporting for LM Uptime
- Usage Reporting for SaaS Monitoring
- Usage Reporting for IaaS Monitoring
- Usage Reporting for PaaS Monitoring
- Usage Reporting for APM Traces
- Usage Reporting for APM Synthetics
- Usage Reporting for Devices
- Usage Reporting for Websites
- Usage Reporting for Wireless Access Points
- Audit Logs
- Ops Notes
- Security Settings
- User Access
- Collectors
-
Dashboards
- Dashboards Overview
- Dashboard Creation
- Modern Dashboards
- Adding Dashboard Groups
- Finding Dashboards and Dashboard Groups
-
Widgets
- Widgets Overview
- Widgets Creation
- Widget Datapoint Configurations
-
Widget Types
- Alert List Widget
- Big Number Widget
- Netflow Widget
- NOC Widget
- Log Query Widget
- Pie Chart Widget
- Table Widget
- Text Widget
- Website Status Widget
- Custom Graph Widget
- SLA Widget
- Topology Map Widget
- Gauge Widget
- HTML Widget
- Job Monitor Widget
- Map Widget
- Resource Explorer Widget
- Recommendations Widget
- Billing Widget
- Widget Management
- Standard Widget Configurations
- Enabling Dashboard Text Widget Script Security
- Dashboard Management
- Dashboard Distribution
-
Resource Tree
- Navigating the Resources Page
- Changing the Time Range
- Remote Session
- Using Ops Notes
- Resources Details
- Resource Groups
- Resource Management
- NetScans
- Resource Explorer
- Services
- LM Uptime
-
Websites
- Data Monitored for Websites
- Websites Page Overview
- Alerting on Websites Data
- Trace Route for Websites
-
Websites Management
- Websites Default Settings
- Web Check
- Ping Check
- Testing the Steps of a Web Check
- Creating a Website Dashboard
- Website Properties
- Website Management
- Executing Internal Web Checks using Groovy Scripts
- Web Checks with Form-Based Authentication
- Websites SDT
- Disabling External Website Testing Location Across your Account
- Understanding Website Status Codes
- Websites Groups
- Mappings
- Alerts
-
Reports
- Choosing a Report Type
- Creating a Report Group
- Shared Report Access
-
Report Types
- Alert Forecast Report
- Alert SLA Report
- Alert HealthCheck Report
- Alert Thresholds Report
- Alert Trends Report
- Alerts Report
- Audit Log Report
- Dashboard Report
- Interface Bandwidth Report
- Log Query Report
- NetFlow Resource Metric Report
- Resource Group Inventory Report
- Resource Inventory Report
- Resource Metric Trends Report
- Role Report
- SDT Inventory Report
- Server CPU Report
- Service Level Agreement Report
- User Report
- Website Overview Report
-
Modules
- Modules Overview
- Modules Installation
- Custom Module Creation
- Tokens Available in LogicModule Alert Messages
- Deprecated LogicModules
- Data Collection Methods
- Active Discovery
- Groovy Support
-
Module Configurations
- Types of Modules
- DataSource
- PropertySource
- AppliesTo
- SNMP SysOID Map Configuration
- JobMonitor
- ConfigSource
- TopologySource
- EventSource
-
LogSource
- LogSource Overview
- Configuring a LogSource
- Kubernetes Event Logging LogSource Configuration
- Kubernetes Pods LogSource Configuration
- Log Files LogSource Configuration
- Script Logs LogSource Configuration
- SNMP Traps LogSource Configuration
- Supported MIBs for SNMP Trap Translation
- SNMP Trap MIBs
- Troubleshooting MIBs to JSON Converter Utility Issues
- Troubleshooting SNMP Traps Issues
- Modules Management
- Access Groups for Modules
- Security
-
LM Logs
- LM Logs Overview
- Log Ingestion
- Log Processing
- Logs Partition
- Log Anomaly Detection
- Log Analysis
- Viewing Logs and Log Anomalies
- Reset Log Anomaly Detection
- Log Patterns
- Log Query Language
- Log Processing Pipelines
- Log Alert Conditions
- Logs Roles and Permissions
- LM Logs Usage Data
- Troubleshooting Logs
-
Cloud Monitoring
- Introduction to Cloud Monitoring
- Cloud Services and Resource Units
- Monitored Locations for Cloud Monitoring
- Cloud Monitoring using a Collector for Existing Cloud Resources
- Monitoring Utilized Cloud Service Limits
- Custom Event Integrations Setup
-
Amazon Web Services Monitoring
- AWS Monitoring Setup
- AWS Organizational Unit Monitoring Setup
- Using StackSets to Automate Role and Policy Creation
- AWS Billing Monitoring Setup
- CloudWatch Costs Associated with Monitoring
- Managing your AWS devices in LogicMonitor
- AWS Tag Usage in LogicMonitor
- AWS Cost by Tag Monitoring
- Active Discovery and AWS CloudWatch Metrics
- Customizing AWS CloudWatch DataSources
- Troubleshooting Custom AWS CloudWatch DataSources
- Microsoft Azure Monitoring
- Google Cloud Platform Monitoring
- MongoDB Atlas Monitoring
- Cost Optimization
- Cloud Data Collection with Poll Now
- SaaS Monitoring
-
Edwin AI
- Introduction to Edwin AI
- Key Concepts in Edwin AI
- Edwin AI Roles and Users
- Configure Edwin AI Dashboard
- Edwin AI Models
- Configure Edwin AI Actions
- Edwin AI Rules
- Working with Edwin AI
- Export and Import Edwin AI Configuration
-
Edwin AI Integrations
- Edwin AI Integrations Overview
- Edwin AI Integration YAML File
- Edwin AI Custom Integrations
- Edwin AI Monitoring Integrations
-
Edwin AI IT Service Management Integrations
- LogicMonitor Data Exchange (LMDX)
- Edwin AI Microsoft Dynamics Integration
- Edwin AI PagerDuty Integration
- Edwin AI Jira Server Integration
-
LM Integrations
- LogicMonitor Integrations Overview
- Navigating the Integration Page
- Communications Integrations
- Workflow Integrations
- Automation Integrations
- Custom Integrations for LogicMonitor
- Logs for LM Integrations
-
Container Monitoring
- About LogicMonitor Container Monitoring
-
Kubernetes Monitoring
- Support Matrix for Kubernetes Monitoring
- Kubernetes and LM Containers Key Concepts and Terms
- Kubernetes Monitoring Considerations and Required Permissions
- Resource Sizing for Performance Optimization and Tuning Recommendations
- LM Container Installation
- LM Container Upgrade
- LM Container Uninstallation
- Existing Configuration Migration
- Kubernetes Events and Pod Logs Collection
-
Resource Monitoring
- Monitoring Helm Charts Releases
- Kubernetes Core Components Monitoring
- Monitoring Kubernetes Clusters with kube-state-metrics
- Filtering Kubernetes Resources for Monitoring
- NGINX Ingress Controller Monitoring
- Kubernetes Certificates and cert-manager Monitoring
- Disabling Alerts on Kubernetes Resources
- Default Filtering for Kubernetes Resources
- Filtering Kubernetes Resources using Labels, Annotations, and Selectors
- Disabling Resources from Monitoring
- Retention of Deleted Kubernetes Resources using LM Containers
- Retaining Deleted Kubernetes Resources
- Advanced Configuration
- Monitor Supported Resources
- Topology for Kubernetes Cluster
- Kubernetes Cluster Monitoring as Non-Admin User
- Troubleshooting Kubernetes Monitoring
- Docker Monitoring
-
LM APM
- LM APM Overview
- Quick Steps to Setup LogicMonitor APM
-
Push Metrics
- Getting Started with Push Metrics
- Use Cases for Push Metrics
- About the Push Metrics REST API
- Ingesting Metrics with the Push Metrics REST API
- Python SDK for Push Metrics API
- .NET SDK for Push Metrics API
- Managing Resources that Ingest Push Metrics
- Rate Limiting for Push Metrics
- Updating Instance Properties with the Push Metrics REST API
- Updating Resource Properties with the Push Metrics REST API
- OpenMetrics Integration
-
Distributed Tracing
- Distributed Tracing Overview
- Application Authentication Overview
- Traces Page
- Application Instrumentation for LogicMonitor
- Trace Data Forwarding to LogicMonitor
- OpenTelemetry Collector for LogicMonitor Overview
- Synthetics
-
Monitoring Solutions
- Apache
- APC
- AI Monitoring
- Atlassian
- AWS
- Azure
- Broadcom
- Cato Networks
- Checkpoint
-
Cisco
- Cisco APIC Monitoring
- Cisco ASA/ASR
- Cisco Catalyst Center
- Cisco Catalyst SD-WAN Monitoring
- Cisco CUCM API Monitoring
- Cisco Device SNMP and NTP Configuration
- Cisco Firepower Chassis Manager Monitoring
- Cisco Firepower Threat Defense Monitoring
- Cisco Hyperflex Monitoring
- Cisco Intersight Monitoring
- Cisco IP SLA Monitoring
- Cisco ISE Monitoring
- Cisco Meraki Monitoring
- Cisco UCCX Monitoring
- Cisco UCS Monitoring
- Cisco UCS X Monitoring
- Cisco Unified Call Manager (CUCM) Monitoring
- Cisco VoIP Monitoring
- Cisco Wireless Monitoring
- Citrix
- Cohesity
- Common Config
- CommVault
- ConnectWise
- Couchbase Server
- Dell Technologies
- Email Service
- Extreme Networks
- F5
- FreeBSD
- Fortinet
- HPE
- IBM
- IMPI
- Infinidat
- Infoblox
- Java
- Jenkins
- Juniper
- Kemp
- Kubernetes
- Linux
- LogicMonitor
- LSI MegaRAID Controller
- Microsoft
- MongoDB
- NetApp
- Network Traffic Monitoring
- NTP
- Nutanix Systems
- OpenAI
- Oracle
- Palo Alto Networks
- Panzura
- Perfmon Access
- Pick
- Puppet
- Pure Storage
- Quantum
- RabbitMQ
- Redis
- Rubrik
- Ruckus
- SAP
- Slack
- SSL
- SNMP
- Sonicwall
- SumoLogic
- SwiftStack
- Ubiquiti
- Unomaly
- Varnish
- Veeam
- Versa SD-WAN
- Mobile
-
Developer
-
LogicMonitor REST API
-
REST API Overview
- Using LogicMonitor's REST API
- Migration to LogicMonitor REST API v3
- REST API Change Log
- REST API Authentication
- REST API Status Codes
- REST API Error Codes
- REST API Rate Limit
- REST API Troubleshooting
-
REST API v3
- REST API v3 Swagger Documentation
- LogicMonitor v3 SDK
- REST API Basic Filters
- REST API Advanced Filters
- Creating Services Using LogicMonitor REST API v3
- Delta Support for device/devices API
- Best Practices for Migrating to LogicMonitor v3 SDK
-
REST API v3 Endpoints
- Managing Alerts
- Managing Alert Rules
- Managing Cost Optimization Recommendations
- Managing Recipient Groups
- Managing Roles
- Managing Ops Notes
- Managing Report Groups
- Managing Dashboard Groups
- Managing Collector Groups
- Managing ConfigSources
- Managing EventSources
- Managing Collector Debug Command
- Managing Collector Version
- Managing NetScan
- Managing PropertySources
- Viewing Metrics
- Viewing Integration Audit Logs
- Viewing External APIs
- Managing AppliesToFunction
- Managing Devices
- Managing DataSources
- Managing Escalation Chains
- Managing API Tokens
- Managing DataSource Instances
- Managing Dashboards
- Managing Users
- Managing Audit Logs
- Managing Data
- Managing Access Group
- Managing OIDs
- Managing Device Groups
- REST API v2
-
REST API v1
- REST API v1 Overview
- Getting Data with the REST API
-
REST API v1 Endpoints
- Managing Alert Rules
- Managing Alerts
- Managing API Tokens
- Accessing Audit Logs
- Managing Collectors
- Managing Collector Groups
- Managing Dashboards and Widgets
- Managing Dashboard Groups
- Managing DataSources
- Managing DataSource Instances
- Managing Devices
-
Managing Device Groups
- About the Device Group Resource
- Add a Device Group
- Add Device Group Properties
- AWS Device Groups
- Azure Device Groups
- Delete Device Group Properties
- Delete a Device Group
- GCP Device Groups
- Get all alerts for a Device Group
- Get all SDTs for a Device Group
- Get Device Group Properties
- Get Device Groups
- Get devices for a particular device group
- Update a Device Group
- Update Device Group Properties
- Managing Escalation Chains
- Managing Ops Notes
- Managing Reports
- Managing Report Groups
- Managing Roles
- Managing SDTs
- Managing Websites
- Managing Website Groups
- Getting Websites Test Locations
- Managing Thresholds
- Managing Users
-
REST API Overview
- Scripting Support
- HAR File in LogicMonitor
-
LogicMonitor REST API
- Policies and Compliance
- Training and Education
-
Legacy UI
- Getting Started
- Devices
- Dashboards and Widgets
- AIOps
- LM Service Insights
- LogicModules
- Terminology and Syntax
- LM APM
-
Cloud Monitoring
-
Getting Started with LM Cloud
- LM Cloud Monitoring Overview
- Enabling Cloud Monitoring using Local Collector
- Visualizing your cloud environment with auto dashboards and reports
- Setting up custom event integrations
- Monitoring Cloud Service Limit Utilization
- Optimizing your Cloud Spend
- Cloud Data Collection
- Amazon Web Services Monitoring
- Google Cloud Platform Monitoring
- MongoDB Atlas Monitoring
-
Getting Started with LM Cloud
- Container Monitoring
- Monitoring Solutions
In this article
- New search aggregate functions
- New Log Usage DataSource
- GD Collector 31.000 released
- Argus 6.1.0 released
- Alerts
- Bug Fixes
- Audit Logs
- Enhancements
- Cloud Monitoring
- Enhancements
- Bug Fixes
- LM Logs
- Enhancements
- LogicModules
- Bug Fixes
- Resources
- Bug Fixes
- New LogicModules
- Updated LogicModules
- Deprecated LogicModules
- LogicMonitor APM Lighthouse Program
- MGD Collector 30.001 Update
Updated on December 20
Fixed an issue that prevented the Microsoft_Azure_AutomationAccountCertificates LogicModule from collecting and reporting data.
Updated on December 10
An update for v162 fixes an issue that prevented the Alerts List widget from displaying alerts. This update is scheduled to be released from December 13 to December 20.
Highlights
- Feature Highlights: Expanded the log search language to support aggregate functions. Added a new Log Usage DataSource to monitor log volume. Released GD Collector 31.000 and Argus v.6.1.0.
- General Updates: Improved logs search performance, added the ability to share log searches with a URL, updated audit log formats for alert thresholds, and more.
- Updated Monitoring: New LogicModules to monitor devices running Selenium and devices running NTPv4.
Feature Highlights
New search aggregate functions

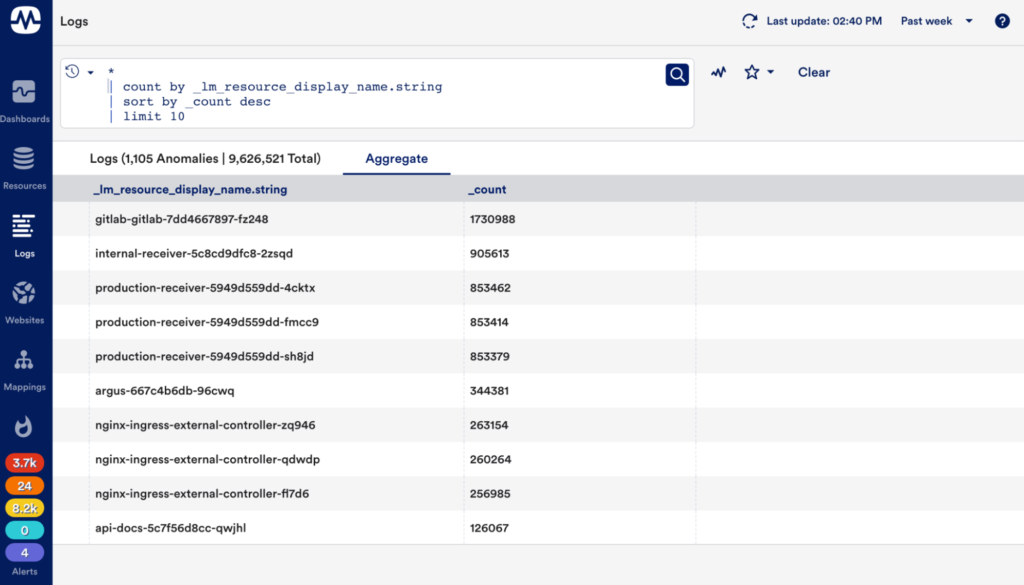
You can now search logs using aggregate functions such as count, filter, limit, parse, and where. After running the search, the results are displayed in a new Aggregate tab. We will continue to expand the search language to include more aggregate functions in future releases. For more information, see Logs Search Language.
Note: This feature is only available for LM Logs Enterprise and Unlimited customers.
New Log Usage DataSource

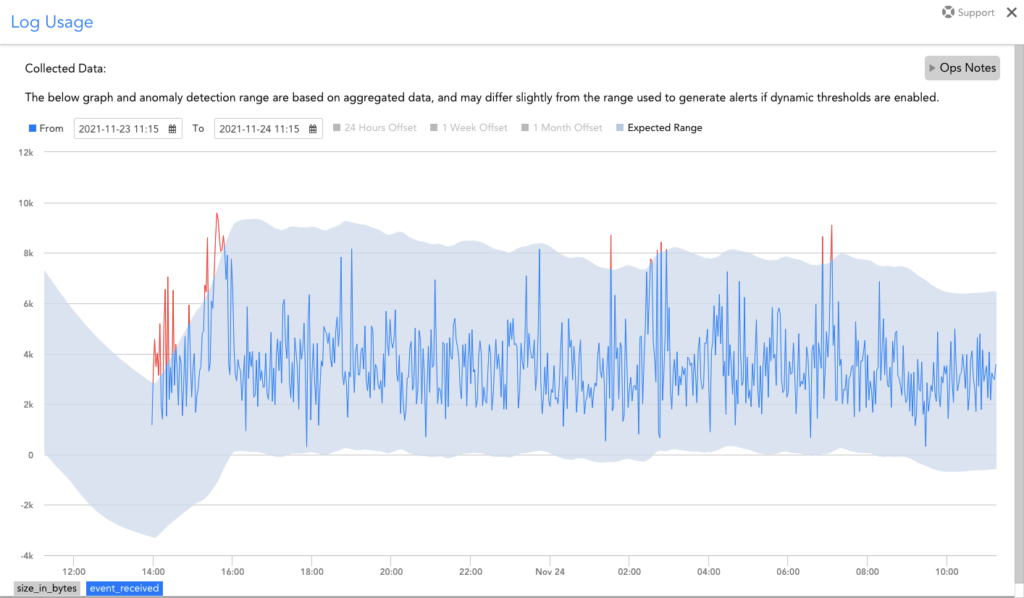
The new Log Usage DataSource has been added to all resources that send logs to LM Logs. The Log Usage DataSource includes the number of log events and the size of the log message. This allows you to view volume anomalies and leverage dynamic thresholds for alert generation when a resource is generating logs at an unexpected rate.
GD Collector 31.000 released
GD Collector 31.000 was released on November 26 and includes all features and fixes from EA Collector 30.104, updated Java to Amazon Corretto 11.0.13.8, and more. For more information, see GD Collector 31.000 Release Notes.
Argus 6.1.0 released
Argus 6.1.0 was released and includes the following updates and fixes:
- Supports Kubernetes (K8S) 1.22, with updated Helm charts for Argus 1.1.0 and Collector-set Controller 0.12.0.
- Support for the new Resource tree can be enabled through Helm chart configuration.
- Minor bug fixes for handling device deletion.
- Externalized the time period for retaining Argus and Collector-set Controller pods after deletion.
General Updates
Alerts
Bug Fixes
- Fixed an issue where adding a note within an EventSource alert would incorrectly clear the alert status.
Audit Logs
Enhancements
- Changed the format of audit logs to make the time zone parsable for alert threshold details. The audit logs do not capture details of before and after time zone when the alert threshold is updated at the group level.
Cloud Monitoring
Enhancements
- Added capability to monitor AWS Transit Gateway Attachments.
Bug Fixes
- Instances without corresponding DataSources for the GCP Cloud APIs have been removed from the resource tree.
- Updated documentation, in-product text, and test permissions functionality to include several missing AWS IAM permissions. If customers are receiving AWS STS errors, they should update the AWS IAM Policy attached to the role they provided LogicMonitor to reduce or eliminate these errors.
- Fixed an issue to ensure that LogicMonitor correctly discovers all AWS CloudFront resources when there are more than 100 instances.
LM Logs
Enhancements
- Improved performance for executing log searches. Logs are retrieved asynchronously for faster returns of the log graph histogram and log table results.
- Added the ability to share a URL to the current query with the option to select an absolute or relative time range. This link can be found in the overflow menu (three dots in the upper right corner of the Logs page).
LogicModules
Bug Fixes
- Fixed an issue where PropertySources would fail without warning when output reached 100 records. The following error now displays: “Warning: A maximum of 100 properties will be applied.”
- Fixed an issue to improve the response time for AppliesTo functions.
Resources
Bug Fixes
- Fixed an issue where dynamic group membership was not updating for system.collectorid.
LogicModule Releases
New and updated LogicModules are available for you to import from the LogicMonitor Public Repository. This section lists the LogicModules that are new in this release, updated in this release, or will be removed in a future release. Changes related to the LogicModule feature will be listed under General Updates.
New LogicModules
LogicModule Name | Details |
LogicMonitor_Collector_SyntheticsSelenium addCategory_SyntheticsCollector |
(1 DataSource, 1 PropertySource) Monitoring for devices running SyntheticsSelenium and corresponding PropertySource to determine Collectors that are monitoring at least one Selenium device. |
NTPv4 | (1 DataSource) Supports NTPv4 which is backward compatible with NTPv3. The old NTP module is kept to support devices running NTPv2 or earlier. See also Updated LogicModules: addCategory_NTPResponds |
Updated LogicModules
LogicModule Name | Details |
Cisco_DNAC_Devices | (1 DataSource) Additional statuses for reachabilityStatus and updated alert thresholds. |
Cisco_Entity_Sensors | (1 DataSource) Now ignores unnamed sensors by default (which are often unreliable as well as hard to action upon issue). This behavior can be reverted via the “sensor.use_modifiers” host property. |
Cisco_Meraki_Licensing | (1 DataSource) Added new license status “License Required” with status code 1. “License Expired” status is now 2 in order to facilitate ease of alerting. |
GCP_Billing_CostByOperation_BigQuery GCP_Billing_CostByProject_BigQuery GCP_Billing_CostByService_BigQuery |
(3 DataSources) These modules were previously collecting on a daily basis. They now retrieve monthly stats and only perform Active Discovery once a day. |
Microsoft_Windows_Services | (1 DataSource) Updated recommended threshold for AutomaticStart_NotRunning in the datapoint description. |
SilverPeak_System_Status | (1 DataSource) Fixed casing typo in disk usage API endpoint. |
VMware_VeloCloud_EdgeHealth VMware_VeloCloud_EdgeLinkEventQuality VMware_VeloCloud_EdgeLinkHealth VMware_VeloCloud_EdgeLinkMetrics addCategory_VeloCloudAPI |
(4 DataSources, 1 PropertySource) Updated proxy code to support device host property for proxy.host and proxy.port to override settings in the Collector. |
addCategory_MSSQL | (1 PropertySource) Updated AppliesTo to exclude devices with “SQL_Node” category. It’s important to note that for SQL Failover Clusters and Always on Availability Groups, the addCategory_WindowsFailoverCluster PropertySource must be run before this one to ensure the correct categories and device properties are applied. |
addCategory_NTPResponds | (1 PropertySource) Added detection for NTP version to apply new category “NTPRespondsV3+” where applicable. |
addCategory_TopoSwitch | (1 PropertySource) Corrected typo in property name system.categories. |
addCategory_Ubiquiti_UniFi | (1 PropertySource) Removed unnecessary check on login response that prevented script from completing on some devices. |
addCategory_VMwareHorizonConnectionServer | (1 PropertySource) Removed VMware Horizon Agent from assigning category “VMwareHorizonConnectionServer” to devices only running the Horizon Agent. |
addERI_Device addERI_Linux addERI_Windows |
(3 PropertySources) Added VM detection. |
\.1\.3\.6\.1\.4\.1\.15497\.1\.2
|
(1 SNMP sysOID Map) Updated a sysOID map to include the Ironport category. |
Deprecated LogicModules
This table lists LogicModules that we are deprecating in this release. This means that these LogicModules will be removed in a future release. If available, a replacement LogicModule is listed.
LogicModule Name Deprecated/Replacement |
Details | End of Support Date |
Removed:\.1\.3\.6\.1\.4\.1\.15497\.1\.(1|2)
Replacement: N/A |
(1 SNMP sysOID Map) Removed a sysOID map because it is duplicated by existing maps. |
N/A |
For the list of LogicModules deprecated over the past five releases, see the support article Deprecated LogicModules.
Looking Ahead
In this section, you will find announcements about upcoming beta features, updates about ongoing beta features, and information about the end-of-life of existing features.
LogicMonitor APM Lighthouse Program
LogicMonitor APM has been available in a limited release capacity for the past few months. We are now getting ready to expand access with the launch of our Lighthouse Program for users that want access to our APM capabilities. Along with early access, qualified customers and prospects will have the opportunity to influence the early direction of our product and provide feedback to enhance our APM offering.
If you are interested in participating in our Lighthouse Program, please fill out the Google form here.
MGD Collector 30.001 Update
The automatic update to MGD Collector 30.001 will deploy on January 10, 2022. This release, which was scheduled for deployment on October 27th, was postponed while we fixed a performance issue. Although no action is required ahead of this date, we do recommend that you update to MGD Collector 30.001 as soon as possible. For more information, see MGD Release Update.
In this article
- New search aggregate functions
- New Log Usage DataSource
- GD Collector 31.000 released
- Argus 6.1.0 released
- Alerts
- Bug Fixes
- Audit Logs
- Enhancements
- Cloud Monitoring
- Enhancements
- Bug Fixes
- LM Logs
- Enhancements
- LogicModules
- Bug Fixes
- Resources
- Bug Fixes
- New LogicModules
- Updated LogicModules
- Deprecated LogicModules
- LogicMonitor APM Lighthouse Program
- MGD Collector 30.001 Update