v.82 Release: Improved Add Collector Display, Script Internal Service Checks, and more
Last updated on 07 December, 2022v.82 will be rolled-out through the first two weeks of November. This marks the second-to-last release of 2016! To fulfill the huge goals we set for our product this year, we fit a ton of new features and improvements into this release. Some highlights include revamping our Add Collector process as well as introducing Script Internal Service Checks, support for several more AWS Services, and a new suite of REST API resources.
Please note during our regular maintenance windows between 11/17-12/15, LogicMonitor will be changing the IP address of your portal endpoint. Read our LM Community post for more information.
New “Add Collector” Configuration
We overhauled the process for Adding Collectors so that it is more intuitive and user friendly, as well as added functionality. You will notice:
- The download process has been reduced to a single screen
- One-click copying of Wget and cURL commands to your clipboard.
- The Collector’s device will be automatically added to monitoring, ensuring device performance does not interfere with data collection. Note that this requires Collector version 22.180 or higher.
- You can pre-select the size of your Collector, which determines how much of its host’s memory will be consumed as well as how many devices the Collector can monitor. This can also be adjusted via the Collector config.
You can read more about our new Add Collector process here.
Script Internal Service Checks
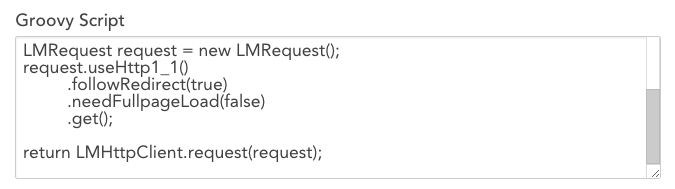
Internal Service Checks now support groovy script based response and request settings. Script Internal Service Checks allow for highly configurable transactional checks, and provide broader support for various authentication requests than our standard settings configuration. Why does this matter? This allows you to check the availability of complex web services from where it is most important- your data centers or your offices. For example, you can verify HipChat’s availability from a Collector at each office location, so that you can know about availability issues before your staff.
We have released a full list of available commands that can be used to write your scripts. Script Internal Service Checks require Collector version 22.180 or higher.
Expanded Support for AWS Services
We added support for monitoring the following AWS services:
REST API
We have published several new resources for the REST API, including the ability to:
- get, add, update and delete roles
- get datasource information
- get data
- PATCH for REST API device groups resource. The PATCH method is useful if you would like to update one or several fields for a device group, but don’t want to include the full JSON definition of the group in the request.
- manage thresholds
- manage instances
PLEASE NOTE: we previously announced a change to our process for engaging customer support. This change will no longer be included in the v.82 release.
Other Notable Improvements
Alerts
- The Alert Table will only display a value to its first two decimal places. Hovering over the value will display it in full.
Dashboards
- Improvements have been made to the Map Widget so that the map will reposition following a change to the location configuration.
- Device Groups can now be specified in the Batchjob widget. This enables compatibility with dashboard tokens.
- If a user attempts to load a Dashboard after disabling cookies, the user will be immediately redirected to the login screen. Previously the application would first attempt to load the dashboard.
Devices
- A two minute timeout has been added when establishing a Remote Session connection.
- We improved Remote Session error messaging, to provide more useful context when errors are encountered.
- When viewing an instance, we now display and link to its parent Datasource in the page header.
- We improved the suggestions dropdown when adding a device via the Manage a Device Group window.
- When more than 100 subgroups exist within a Device Group, we will only display the first 100 with the ability to See More.
- When an invalid URL is entered for the Devices page, you will now be redirected to the root node.
- A new system.staticgroups property has been added which contains non-Dynamic Group membership information for a given device. This property can be used in a custom query for a Dynamic Group, which is useful if you want to pool together devices based on common group membership. This could not be done with system.groups.
- Datasource graphs contained leading and trailing white spaces due to a mis-alignment between the graph’s designated time range and the datapoints’ timestamps. To improve the graph’s display, we now take into account the datapoints immediately prior to and after the designated time range in order to eliminate the white spaces.
- Instance names and values can now be easily selected and copied from the Instance Table.
- We improved performance of Device Trees containing thousands of devices.
- The behavior of Device Favorites now mimics that of the general Device Tree’s search results. Users can click between results and
use the Focus icon to update the Device Tree. - Improvements to autoscaling graphs when Device Dashboards are resized.
Devices (AWS)
- Added support for new AWS region, Mumbai (ap-south-1)
- We will now inform you that datasources need to be imported if you select an AWS service for monitoring and don’t have the necessary datasources in your account
- Added support for new debug commands, useful for debugging data collection and discovery for AWS resources
Mobile
- The Mobile display for the Alert, NOC, and SLA Widgets have been aligned with their desktop display.
Netscan
- Added better validation for Netscan schedules.
- Previously deleted Netscan devices can now be viewed from the Unmonitored Devices Table by selecting either All or Deleted in the status filter. Deleted devices can be moved to monitoring.
Reports
- Removed the Acknowledge button from the Alert Report and Alert Widget configuration.
REST API
- The REST API SDT resource now defaults the start time to the current time.
Service Checks
- Only Collectors of version 22.082 and higher will display as available when adding an Internal Service Check.
- For both Service Checks and Internal Service Checks using only one Collector as a checkpoint, we can now display a Collector Down icon next to the Service Check’s name in the Services Tree as well as next to the Collector’s name in the Checkpoints table.
Settings
- The display name for datasources used in Processes and Services for Windows or Linux cannot be edited. This avoids potential issues in process and service discovery.
- The FilteredEvents property for EventSources will now display in the suggested properties list when setting device & group properties.
- Users can now initiate a payment when there is a balance due via the “Submit Payment” button in the Account Information | Financial tab.
Bugs Fixed
Alerts
- When using a custom property column in the Alerts page, properties with non-alphanumeric characters did not always display correctly.
- The alert filter did not support device names with the pipe character (|).
- HostCluster alerts will now populate host group information using the ##GROUP## token to help unify formatting of integration, custom delivery, and alert message templates.
Dashboards
- Icons were not displaying in the Dashboard dropdown panel for Internet Explorer and Edge.
- Dashboard titles did not immediately refresh after being updated.
- The graph view of the Gauge Widget was displaying an incorrect timestamp.
- NOC Widgets set to “group by instance” weren’t displaying correctly for Eventsources.
- Neflow labels were not displaying for all pie graphs.
- If all alerts were acknowledged when a device was put into SDT, the NOC Widget did not include the acknowledged alert icon.
- The slideshow button did not take effect when a dashboard was set to full screen mode.
- Selecting an instance and choosing ‘apply to all cells’ in the Table Widget did not apply the instance name as expected.
Devices
- Duplicate graph legend names could result from a combination of legacy configuration and multiple instances on a single device.
- When changing the Preferred Collector, only the first 403 available Collectors displayed.
- Although specific datapoint types were hardcoded as gauge, the UI allowed them to be changed to counter or derive.
- If the Device Tree was collapsed and reopened, the previous location was not always refocused correctly.
- Users were unable to mark datasource differences as ‘Audited.’
- Group level Remote Session permissions were not applying to subgroups.
Reports
- Long report descriptions caused an error in the tile view display of reports.
Settings
- Users without rights to edit personal information could not update passwords via the “forgot password” workflow.
- The “suggested results” panel would display off the bottom of the screen if triggered at the bottom of a form.
Services
- Service alerts did not clear when all checkpoints were disabled.
- When Service Default Settings were not changed from the default configuration, new services set to use the default settings were not always added with the correct settings.
- Service Overall Status graphs weren’t always displaying correctly for time periods of 1 year or greater.
v. 82 Point Release
As part of a separate point release, we pushed the following bug fixes to customer accounts on Nov. 10:
- Users were not able to delete an improperly formatted Word document from the Custom Report configuration window after uploading it to their account.
- system.categories were not displaying in the info tab of device groups.
- Collector hosts were being automatically added into monitoring even when the device was already monitored. We now allow users to manually choose whether or not to add Collector hosts into monitoring to avoid duplicate devices.
- Alert table was displaying the length of time since an alert was triggered rather than the duration of time an alert was active.
- Due to performance issues, RegEx is no longer available as a post-processing method for new Web Service Checks.
- One day polling intervals were displaying for all data collection types when using Safari browser. This is now only available for AWS CloudWatch.