Release Note


-
LogicMonitor Platform
- Introduction to LogicMonitor
- In-App Resources
-
Account Information
- Portal Information
- Portal Settings
- Financial
-
Usage Reporting
- Usage Reporting Overview
-
Product-Specific Usage Reporting
- Usage Reporting for APM Metrics
- Usage Reporting for LM Logs
- Usage Reporting for LM Uptime
- Usage Reporting for SaaS Monitoring
- Usage Reporting for IaaS Monitoring
- Usage Reporting for PaaS Monitoring
- Usage Reporting for APM Traces
- Usage Reporting for APM Synthetics
- Usage Reporting for Devices
- Usage Reporting for Websites
- Usage Reporting for Wireless Access Points
- Audit Logs
- Ops Notes
- Security Settings
- User Access
- Collectors
-
Dashboards
- Dashboards Overview
- Dashboard Creation
- Modern Dashboards
- Adding Dashboard Groups
- Finding Dashboards and Dashboard Groups
-
Widgets
- Widgets Overview
- Widgets Creation
- Widget Datapoint Configurations
-
Widget Types
- Alert List Widget
- Big Number Widget
- Netflow Widget
- NOC Widget
- Log Query Widget
- Pie Chart Widget
- Table Widget
- Text Widget
- Website Status Widget
- Custom Graph Widget
- SLA Widget
- Topology Map Widget
- Gauge Widget
- HTML Widget
- Job Monitor Widget
- Map Widget
- Resource Explorer Widget
- Recommendations Widget
- Billing Widget
- Widget Management
- Standard Widget Configurations
- Enabling Dashboard Text Widget Script Security
- Dashboard Management
- Dashboard Distribution
-
Resource Tree
- Navigating the Resources Page
- Changing the Time Range
- Remote Session
- Using Ops Notes
- Resources Details
- Resource Groups
- Resource Management
- NetScans
- Resource Explorer
- Services
- LM Uptime
-
Websites
- Data Monitored for Websites
- Websites Page Overview
- Alerting on Websites Data
- Trace Route for Websites
-
Websites Management
- Websites Default Settings
- Web Check
- Ping Check
- Testing the Steps of a Web Check
- Creating a Website Dashboard
- Website Properties
- Website Management
- Executing Internal Web Checks using Groovy Scripts
- Web Checks with Form-Based Authentication
- Websites SDT
- Disabling External Website Testing Location Across your Account
- Understanding Website Status Codes
- Websites Groups
- Mappings
- Alerts
-
Reports
- Choosing a Report Type
- Creating a Report Group
- Shared Report Access
-
Report Types
- Alert Forecast Report
- Alert SLA Report
- Alert HealthCheck Report
- Alert Thresholds Report
- Alert Trends Report
- Alerts Report
- Audit Log Report
- Dashboard Report
- Interface Bandwidth Report
- Log Query Report
- NetFlow Resource Metric Report
- Resource Group Inventory Report
- Resource Inventory Report
- Resource Metric Trends Report
- Role Report
- SDT Inventory Report
- Server CPU Report
- Service Level Agreement Report
- User Report
- Website Overview Report
-
Modules
- Modules Overview
- Modules Installation
- Custom Module Creation
- Tokens Available in LogicModule Alert Messages
- Deprecated LogicModules
- Data Collection Methods
- Active Discovery
- Groovy Support
-
Module Configurations
- Types of Modules
- DataSource
- PropertySource
- AppliesTo
- SNMP SysOID Map Configuration
- JobMonitor
- ConfigSource
- TopologySource
- EventSource
-
LogSource
- LogSource Overview
- Configuring a LogSource
- Kubernetes Event Logging LogSource Configuration
- Kubernetes Pods LogSource Configuration
- Log Files LogSource Configuration
- Script Logs LogSource Configuration
- SNMP Traps LogSource Configuration
- Supported MIBs for SNMP Trap Translation
- SNMP Trap MIBs
- Troubleshooting MIBs to JSON Converter Utility Issues
- Troubleshooting SNMP Traps Issues
- Modules Management
- Access Groups for Modules
- Security
-
LM Logs
- LM Logs Overview
- Log Ingestion
- Log Processing
- Logs Partition
- Log Anomaly Detection
- Log Analysis
- Viewing Logs and Log Anomalies
- Reset Log Anomaly Detection
- Log Patterns
- Log Query Language
- Log Processing Pipelines
- Log Alert Conditions
- Logs Roles and Permissions
- LM Logs Usage Data
- Troubleshooting Logs
-
Cloud Monitoring
- Introduction to Cloud Monitoring
- Cloud Services and Resource Units
- Monitored Locations for Cloud Monitoring
- Cloud Monitoring using a Collector for Existing Cloud Resources
- Monitoring Utilized Cloud Service Limits
- Custom Event Integrations Setup
-
Amazon Web Services Monitoring
- AWS Monitoring Setup
- AWS Organizational Unit Monitoring Setup
- Using StackSets to Automate Role and Policy Creation
- AWS Billing Monitoring Setup
- CloudWatch Costs Associated with Monitoring
- Managing your AWS devices in LogicMonitor
- AWS Tag Usage in LogicMonitor
- AWS Cost by Tag Monitoring
- Active Discovery and AWS CloudWatch Metrics
- Customizing AWS CloudWatch DataSources
- Troubleshooting Custom AWS CloudWatch DataSources
- Microsoft Azure Monitoring
- Google Cloud Platform Monitoring
- MongoDB Atlas Monitoring
- Cost Optimization
- Cloud Data Collection with Poll Now
- SaaS Monitoring
-
Edwin AI
- Introduction to Edwin AI
- Key Concepts in Edwin AI
- Edwin AI Roles and Users
- Configure Edwin AI Dashboard
- Edwin AI Models
- Configure Edwin AI Actions
- Edwin AI Rules
- Working with Edwin AI
- Export and Import Edwin AI Configuration
-
Edwin AI Integrations
- Edwin AI Integrations Overview
- Edwin AI Integration YAML File
- Edwin AI Custom Integrations
- Edwin AI Monitoring Integrations
-
Edwin AI IT Service Management Integrations
- LogicMonitor Data Exchange (LMDX)
- Edwin AI Microsoft Dynamics Integration
- Edwin AI PagerDuty Integration
- Edwin AI Jira Server Integration
-
LM Integrations
- LogicMonitor Integrations Overview
- Navigating the Integration Page
- Communications Integrations
- Workflow Integrations
- Automation Integrations
- Custom Integrations for LogicMonitor
- Logs for LM Integrations
-
Container Monitoring
- About LogicMonitor Container Monitoring
-
Kubernetes Monitoring
- Support Matrix for Kubernetes Monitoring
- Kubernetes and LM Containers Key Concepts and Terms
- Kubernetes Monitoring Considerations and Required Permissions
- Resource Sizing for Performance Optimization and Tuning Recommendations
- LM Container Installation
- LM Container Upgrade
- LM Container Uninstallation
- Existing Configuration Migration
- Kubernetes Events and Pod Logs Collection
-
Resource Monitoring
- Monitoring Helm Charts Releases
- Kubernetes Core Components Monitoring
- Monitoring Kubernetes Clusters with kube-state-metrics
- Filtering Kubernetes Resources for Monitoring
- NGINX Ingress Controller Monitoring
- Kubernetes Certificates and cert-manager Monitoring
- Disabling Alerts on Kubernetes Resources
- Default Filtering for Kubernetes Resources
- Filtering Kubernetes Resources using Labels, Annotations, and Selectors
- Disabling Resources from Monitoring
- Retention of Deleted Kubernetes Resources using LM Containers
- Retaining Deleted Kubernetes Resources
- Advanced Configuration
- Monitor Supported Resources
- Topology for Kubernetes Cluster
- Kubernetes Cluster Monitoring as Non-Admin User
- Troubleshooting Kubernetes Monitoring
- Docker Monitoring
-
LM APM
- LM APM Overview
- Quick Steps to Setup LogicMonitor APM
-
Push Metrics
- Getting Started with Push Metrics
- Use Cases for Push Metrics
- About the Push Metrics REST API
- Ingesting Metrics with the Push Metrics REST API
- Python SDK for Push Metrics API
- .NET SDK for Push Metrics API
- Managing Resources that Ingest Push Metrics
- Rate Limiting for Push Metrics
- Updating Instance Properties with the Push Metrics REST API
- Updating Resource Properties with the Push Metrics REST API
- OpenMetrics Integration
-
Distributed Tracing
- Distributed Tracing Overview
- Application Authentication Overview
- Traces Page
- Application Instrumentation for LogicMonitor
- Trace Data Forwarding to LogicMonitor
- OpenTelemetry Collector for LogicMonitor Overview
- Synthetics
-
Monitoring Solutions
- Apache
- APC
- AI Monitoring
- Atlassian
- AWS
- Azure
- Broadcom
- Cato Networks
- Checkpoint
-
Cisco
- Cisco APIC Monitoring
- Cisco ASA/ASR
- Cisco Catalyst Center
- Cisco Catalyst SD-WAN Monitoring
- Cisco CUCM API Monitoring
- Cisco Device SNMP and NTP Configuration
- Cisco Firepower Chassis Manager Monitoring
- Cisco Firepower Threat Defense Monitoring
- Cisco Hyperflex Monitoring
- Cisco Intersight Monitoring
- Cisco IP SLA Monitoring
- Cisco ISE Monitoring
- Cisco Meraki Monitoring
- Cisco UCCX Monitoring
- Cisco UCS Monitoring
- Cisco UCS X Monitoring
- Cisco Unified Call Manager (CUCM) Monitoring
- Cisco VoIP Monitoring
- Cisco Wireless Monitoring
- Citrix
- Cohesity
- Common Config
- CommVault
- ConnectWise
- Couchbase Server
- Dell Technologies
- Email Service
- Extreme Networks
- F5
- FreeBSD
- Fortinet
- HPE
- IBM
- IMPI
- Infinidat
- Infoblox
- Java
- Jenkins
- Juniper
- Kemp
- Kubernetes
- Linux
- LogicMonitor
- LSI MegaRAID Controller
- Microsoft
- MongoDB
- NetApp
- Network Traffic Monitoring
- NTP
- Nutanix Systems
- OpenAI
- Oracle
- Palo Alto Networks
- Panzura
- Perfmon Access
- Pick
- Puppet
- Pure Storage
- Quantum
- RabbitMQ
- Redis
- Rubrik
- Ruckus
- SAP
- Slack
- SSL
- SNMP
- Sonicwall
- SumoLogic
- SwiftStack
- Ubiquiti
- Unomaly
- Varnish
- Veeam
- Versa SD-WAN
- Mobile
-
Developer
-
LogicMonitor REST API
-
REST API Overview
- Using LogicMonitor's REST API
- Migration to LogicMonitor REST API v3
- REST API Change Log
- REST API Authentication
- REST API Status Codes
- REST API Error Codes
- REST API Rate Limit
- REST API Troubleshooting
-
REST API v3
- REST API v3 Swagger Documentation
- LogicMonitor v3 SDK
- REST API Basic Filters
- REST API Advanced Filters
- Creating Services Using LogicMonitor REST API v3
- Delta Support for device/devices API
- Best Practices for Migrating to LogicMonitor v3 SDK
-
REST API v3 Endpoints
- Managing Alerts
- Managing Alert Rules
- Managing Cost Optimization Recommendations
- Managing Recipient Groups
- Managing Roles
- Managing Ops Notes
- Managing Report Groups
- Managing Dashboard Groups
- Managing Collector Groups
- Managing ConfigSources
- Managing EventSources
- Managing Collector Debug Command
- Managing Collector Version
- Managing NetScan
- Managing PropertySources
- Viewing Metrics
- Viewing Integration Audit Logs
- Viewing External APIs
- Managing AppliesToFunction
- Managing Devices
- Managing DataSources
- Managing Escalation Chains
- Managing API Tokens
- Managing DataSource Instances
- Managing Dashboards
- Managing Users
- Managing Audit Logs
- Managing Data
- Managing Access Group
- Managing OIDs
- Managing Device Groups
- REST API v2
-
REST API v1
- REST API v1 Overview
- Getting Data with the REST API
-
REST API v1 Endpoints
- Managing Alert Rules
- Managing Alerts
- Managing API Tokens
- Accessing Audit Logs
- Managing Collectors
- Managing Collector Groups
- Managing Dashboards and Widgets
- Managing Dashboard Groups
- Managing DataSources
- Managing DataSource Instances
- Managing Devices
-
Managing Device Groups
- About the Device Group Resource
- Add a Device Group
- Add Device Group Properties
- AWS Device Groups
- Azure Device Groups
- Delete Device Group Properties
- Delete a Device Group
- GCP Device Groups
- Get all alerts for a Device Group
- Get all SDTs for a Device Group
- Get Device Group Properties
- Get Device Groups
- Get devices for a particular device group
- Update a Device Group
- Update Device Group Properties
- Managing Escalation Chains
- Managing Ops Notes
- Managing Reports
- Managing Report Groups
- Managing Roles
- Managing SDTs
- Managing Websites
- Managing Website Groups
- Getting Websites Test Locations
- Managing Thresholds
- Managing Users
-
REST API Overview
- Scripting Support
- HAR File in LogicMonitor
-
LogicMonitor REST API
- Policies and Compliance
- Training and Education
-
Legacy UI
- Getting Started
- Devices
- Dashboards and Widgets
- AIOps
- LM Service Insights
- LogicModules
- Terminology and Syntax
- LM APM
-
Cloud Monitoring
-
Getting Started with LM Cloud
- LM Cloud Monitoring Overview
- Enabling Cloud Monitoring using Local Collector
- Visualizing your cloud environment with auto dashboards and reports
- Setting up custom event integrations
- Monitoring Cloud Service Limit Utilization
- Optimizing your Cloud Spend
- Cloud Data Collection
- Amazon Web Services Monitoring
- Google Cloud Platform Monitoring
- MongoDB Atlas Monitoring
-
Getting Started with LM Cloud
- Container Monitoring
- Monitoring Solutions
In this article
The v.87 release will be rolled out through the first week of April. Improved user experience was the name of the game for v.87. You will notice huge improvements to our customer support flow as well as our Ops Notes and Custom Graph widget configuration. Additionally, we added major new functionality to each of these features- check them out!
Customer Support Flow Overhaul
Need answers? Our new customer support flow can help! We streamlined the process for answering your questions with the click of a button by centralizing our support documentation, release notes, and support requests/chat options in a “Get Help” dialog. Everything you’re used to seeing in the old Help dropdown menu will still be included- and more.
Why you care: The new support flow will guide you to more targeted support articles to address your questions. Additionally, we will auto-fill portions of your support ticket based on your search queries, saving you time and allowing us to resolve your issues more rapidly.
NOTE: the new customer support flow will be enabled for all customers after the v.87 release is fully deployed.
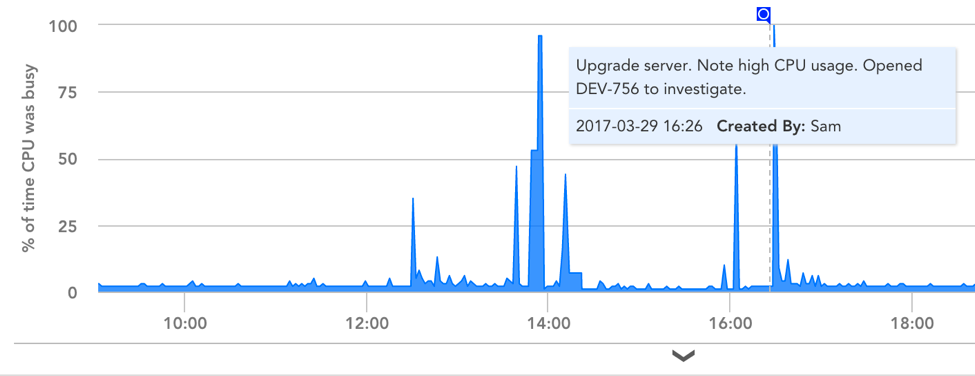
We are very excited to announce our revamped Ops Notes! Ops Notes are a powerful way to correlate events—be it manual device changes, upgrades, or releases—with performance changes in your environment. The many improvements we made include:
- Applying an Ops Note to a specific device or group, decreasing note noise. If applied, the device or group will filter which notes are shown based on which devices or groups are represented in the graph.
- Improving the display of Ops Note annotations in graphs, making them more accessible without disrupting workflows.
- Making Ops Notes searchable based on “Created by” fields and tags. Tags allow you to group events based on shared characteristics, i.e. creating tags for all Ops Notes related to software upgrades or bugs. This is a great way to keep a historical log of similar events.
- Turning notes on and off based on groups, devices, and tags.
Why you care: the ability to annotate your graphs and correlate events across devices/device groups is crucial for root-cause analysis and for determining the extent of an incident’s impact on your environment. Organizing these annotations based on tags will also allow you to keep a historical record of events and associated trends. This is invaluable for refining your team’s processes, contextualizing changes, and avoiding/minimizing similar issues in the future.
PLEASE NOTE: during the v.87 upgrade of your account, you may experience a period of up to 20 minutes during which you will not be able to view Ops Notes. This upgrade will occur during our normally scheduled maintenance window.
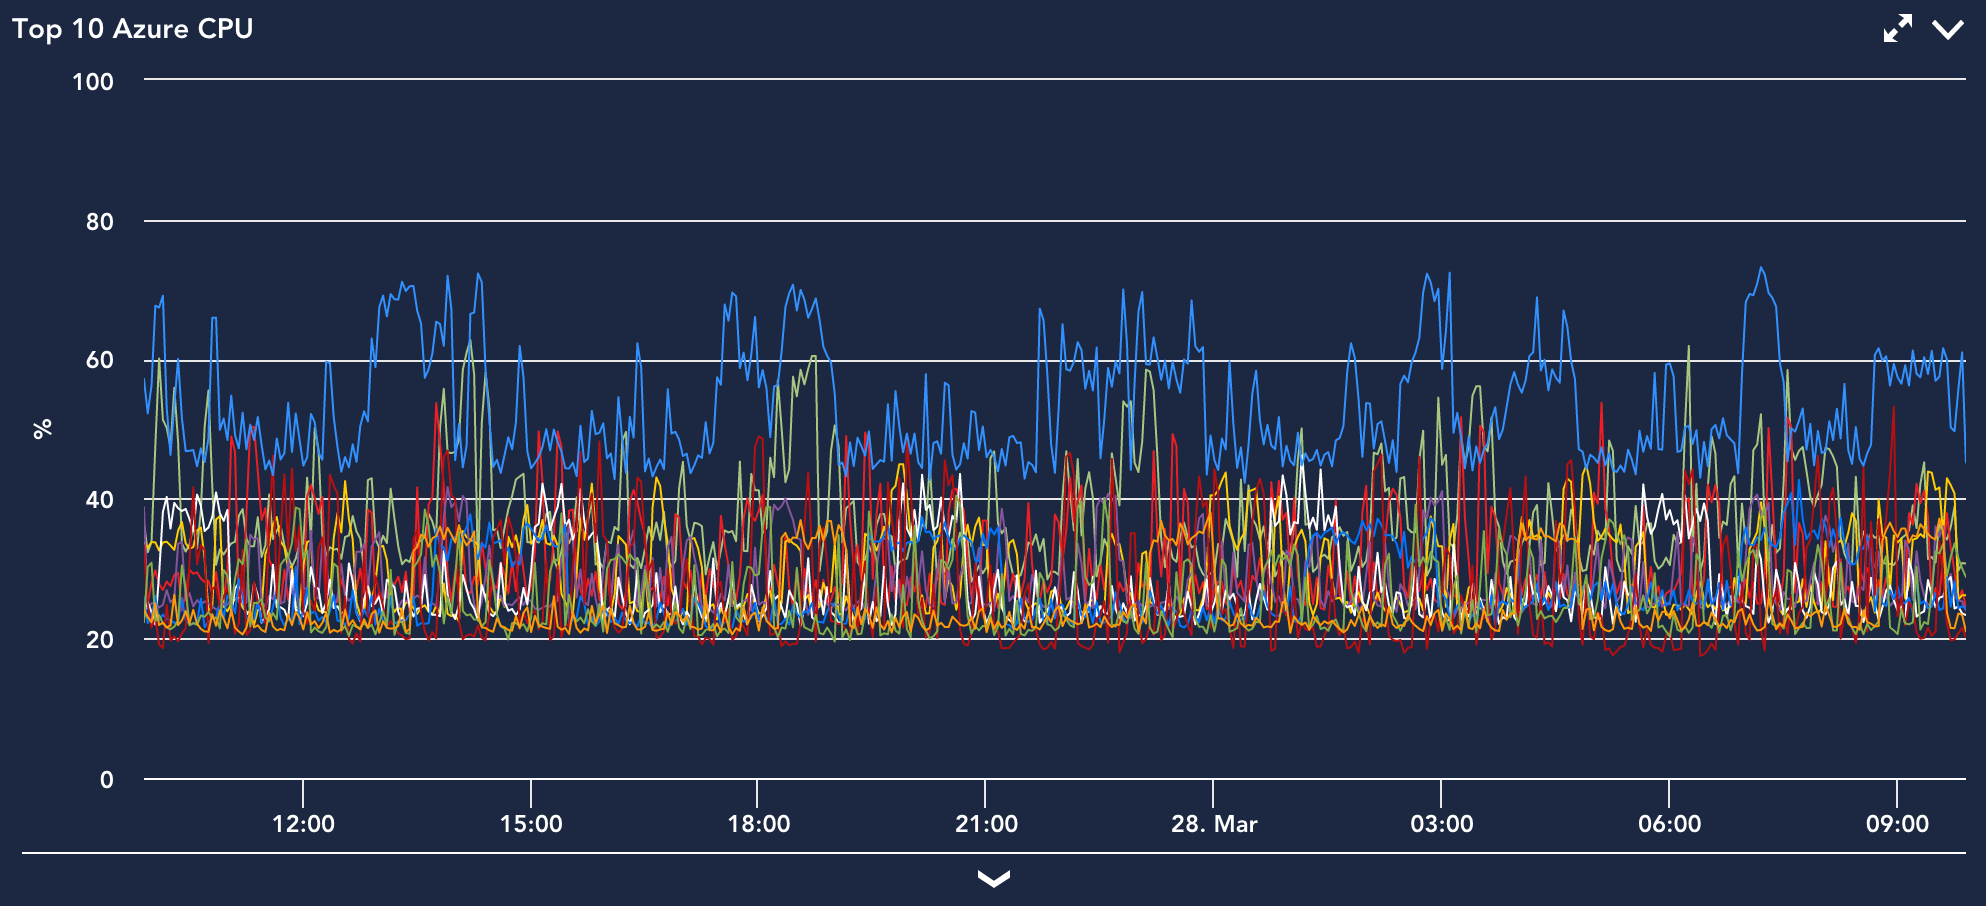
The Custom Graph Widget is one of the most powerful tools in LogicMonitor. You can configure a graph based on almost any data in your account and manipulate its display to suit your needs. However, such a wide-open field means that creating this widget can sometimes be daunting. To make this experience easier, we redesigned the Custom Graph Widget for improved usability and functionality. One of the biggest changes is our new VaST (Visually Significant Trending) algorithm for data display. VaST is a revolutionary way of displaying massive amounts of consolidated data without losing important details or inflection points. Other changes you will notice include:
- A simplified configuration process
- The ability to select from predefined data types (numbers, percentages, etc.)
- Autoscaling and auto-adjusting graph ranges for clearer display
Why you care: the Custom Graph Widget is the ideal way to compare aggregates or individual datapoints from across devices, groups, or your entire account. For instance, you may want a widget to display the Top 10 ports with the heaviest traffic so you can see what is using up all your bandwidth, or you could use it to compare two related datapoints such as Disk IO and CPU usage. A simplified configuration and more detailed visualization will ensure you have the clearest view of the trending data you need.
EventSource Improvements
We previously allowed you to suppress Windows EventSource duplicates in an effort to decrease alert noise. We have auto-applied this behavior to all EventSource types and have increased the minimum clear interval to 5 minutes. Given the potential for a single event to trigger a large number of alerts, these changes are also protective measures to ensure that our alert delivery system’s performance is not strained by redundant alerts.
REST API
We’re releasing the following bug fixes and new features with version 1.1.1 of our REST API:
- When aggregate is set to “true” for Custom Graph Widgets, we now default the individual datapoint aggregation function and graph line colors. These no longer have to be explicitly included in the request.
- We’ve published the ability to GET a properties sub-resource for Services: /service/services/{id}/properties. This resource will return all properties for the specified service along with the type for each property (inherited, custom), which enables you to easily retrieve and identify Service properties.
- We published the ability to GET, POST, PUT, and DELETE Alert Rules via our REST API.
Remember that only major version can be specified in REST API requests, and you will get the most recent version of the request resource, so you’ll see these changes automatically with v87. Because these changes are only associated with new minor and patch versions, they are backward compatible. For more information on how our REST API is versioned, see our documentation.
Other Improvements
Alerts
- The option to “send status notifications for acknowledge or SDT” under Alert Rules now includes notifications for alert note changes. If left unchecked, notifications will not be sent when a note is updated for an alert.
- Collector failover alerts will now respect SDT periods.
Collector
- We have updated our wording in the Collector install window to clarify the
amount of memory required for different Collector sizes. Please note that for performance reasons, the Collector requires more memory than it uses. - !splist and !spdetail commands are now listed in the help menu for the Collector Debug Facility.
Dashboards
- SDT periods can now be excluded from the Device SLA widget.
- When over 100 dashboard groups or subgroups exist, we will display ‘See More’ to ensure expected performance.
- NOC Widget filters design was updated.
Devices
- Remote Session will now rely on Port 443, not port 5566. This change affects EA Collector 23.076 and higher.
- We have improved the individual device Netflow tab to now display the Top Talkers in a stacked area graph to better visualize flows.
- Added a property, system.netscaninfo, to show which Netscan policy added a device. This was previously stored as the device description, which was often edited or cluttered the user experience.
Devices- AWS
- Added support for two new AWS regions: London (eu-west-2) and Canada (ca-central-1 )
Graphs
- As part of recent graph improvements, it is possible to select specific lines for viewing while greying others out. The selected line will now always appear in front of all non-selected lines.
LogicModules
- Added the options to “Force device match” as well as import and export PropertySources as JSON
- Added the ability to view associated devices for all PropertySources
- Added code highlighting to the embedded Groovy fields for scripted LogicModules
Reports
- We now support glob expressions on the Alert Threshold Report
Settings
- Simplified Account Settings pages and now auto-save most changes after editing Payment and two-factor authentication changes still require confirmation before saving
- Added the “Sort” function for the status field in the User / Roles table
Bugs Fixed
- ServiceNow custom properties were overwritten by the ServiceNow Integration defaults.
- Device display names displayed incorrectly when importing via CSV Netscan.
- Fixed a few issues with inserting tokens into dashboard widgets
- ‘\’ was not escaped correctly when using quotes in a Groovy script.
- The NOC widget ##instance## token now correctly resolves only to instance name, instead of DataSource name.
- The Alert Trends report wasn’t always accurate when displaying historical alerts.
- Glob expressions used in the group field of the Service NOC widget were not matching on full group path