v.89 Release: Alerts Table Overhaul and Expanded "Test Script" Functionality
Last updated on 14 September, 2022The v. 89 release will be rolled out through the middle of May. An overarching theme of this release is swifter workflows, particularly those involving alert remediation (improved Alerts Table) and LogicModule creation (expanded “Test Script” application).
Alerts Table Overhaul
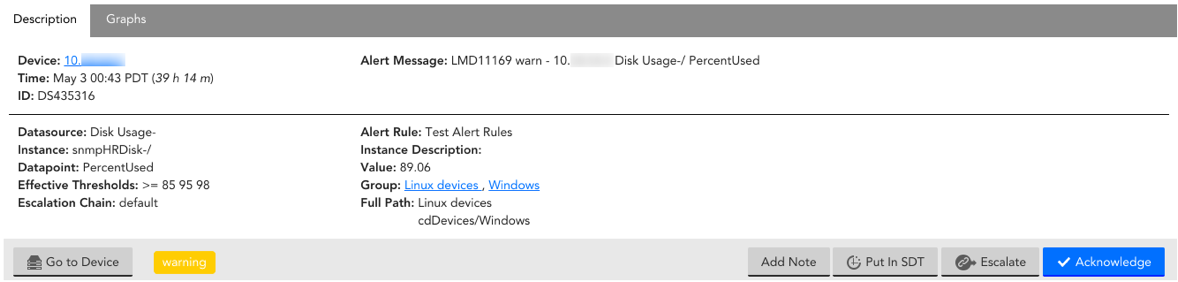
We overhauled the look and functionality of the Alerts Table to streamline alert remediation. This includes improved workflows for escalating/SDTing/acknowledging an alert and one-click navigation to an alert’s associated device. Additionally, we have embedded a new “Graphs” tab within the table which displays the relevant DataSource graphs.
Why you care: The Alerts Table is often a starting point for issue remediation when an alert is triggered. Previously, in order to put an alert in context and gather more data, a user would have to navigate away from the Alerts Table to the devices tab to view relevant graphs and dig into the device’s history. We brought graphs directly into the Alerts Table and now permit one-click navigation to an in-alert device. This will cut down time-to-resolution for troubleshooting.
“Test Script” for DataSources and ConfigSources
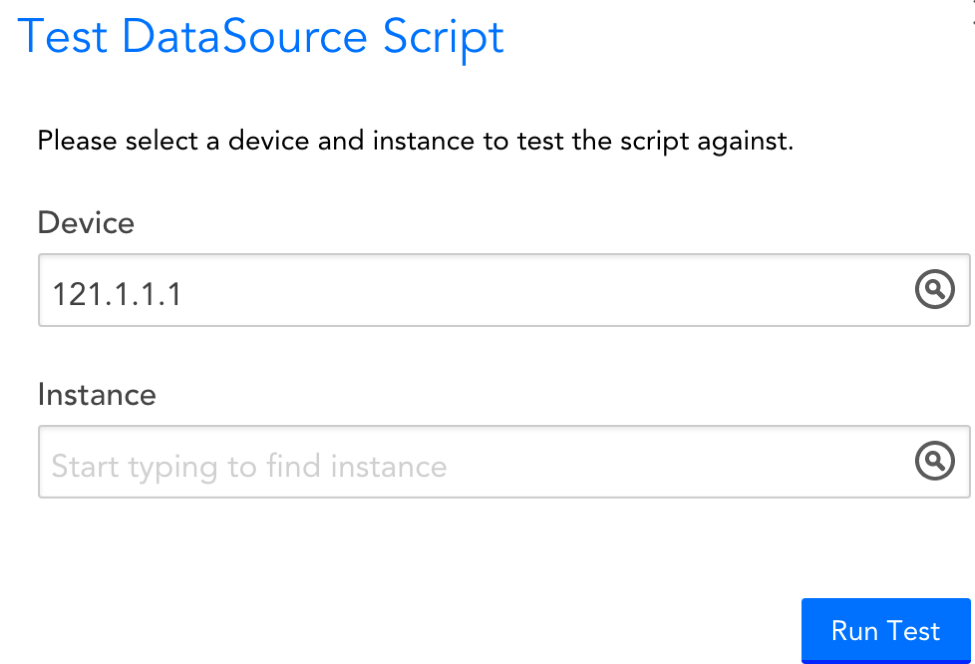
We implemented the “Test Script” functionality for DataSources and ConfigSources, which enables you to see the collection output for a particular device.
Note: “Test Script” has a Collector dependency of 23.102 for ConfigSources and DataSources.
Why you care: Test Script is useful for troubleshooting unexpected returned data or speeding up the DataSource/ConfigSource development process by allowing you to view a script’s output and verify whether it is in line with what you need or expect from the LogicModule.
Improvements
Collectors:
-
In the Collectors page (Settings | Collectors), we have added an Update History tab which displays the previous/new versions of a Collector, the date it was updated, Collector ID/Status, and any notes relevant to the upgrade.
Dashboards
- “Show more” functionality is now available for individual dashboards, ensuring dashboard groups with over 100 dashboards will not impact load time.
- Added the ability to assign colors to the Big Number Widget based on designated thresholds. For instance, the widget may normally be blue but will turn red if displayed value passes a critical alert threshold.
Devices
- Ops Notes can now be added directly from a graph.
- You can now grant “view” permissions on device configs for roles that do not have “manage” rights on a device. This will enable “view only” roles to see entire configs and config changes. This option is not enabled by default.
- Show more functionality has been added to the Group level graphs tab
- The device wizard will auto-assign a Collector if only one exists.
- Added support for double-click in device search results. Double-click will now focus the tree on the selected item.
- Added legend toggles to DataSource and instance-level graphs tab.
- Added an icon that will display when a single instance DataSource is disabled or alerting is turned off.
Devices (AWS)
- We added a regenerate option to the AWS group External Id field. This enables you to replace the External ID in the AWS IAM role LogicMonitor uses for data collection.
- We added a new property, system.aws.TargetGroupId, for AWS Application Load Balancers. This is useful because it enables you to manipulate and organize Application ELBs by target group information.
Integrations
- We increased the number of results returned when querying the Company list for the ConnectWise v2 integration.
- We updated the parameter used to define “Company ID” to a RESTful format in the ConnectWise v2 integration’s payload.
REST API
With the following improvements, our REST API version has been updated to 1.2.2.
- When adding private dashboards, groupId/Name are ignored (as private dashboards belong to users). The API response now makes this clear.
- We now return non-inherited system properties with the devices resource. This is useful if you are trying to search devices by system property value, and especially useful for AWS devices where most information is added as system properties.
- Improved error message when a non-existent API resource is requested.
Services
- A default Collector is now required if Internal Service Checks are set to the default Service settings.
Settings
- We previously logged failed API requests in the Audit Log. To make this less noisy, we now limit these logs to one per minute and grouped similar failed requests together.
Other Improvements
- The Services and Netscan trees have been updated to mirror the Device Tree design.
- Minor Ops Notes display improvements.
Bug Fixes
- The Custom Graph Widget will no longer allow changes to be saved if specified datapoint is invalid.
- A country code could be submitted twice for non-US based numbers when initially enabling Two-Factor Authentication. This prevented proper use of the Authy application.
- The SDT status of child services was not reflected in the status of the parent group in the service tree.
- Active Discovery set to run at 10-minute intervals was actually running at 15-minute intervals. We updated the option from 10 to 15 minutes to accurately reflect this.
- The “Required Field” was not appearing on certain integration forms.
- SDT history was not properly displaying in the Services page.
LogicModule Releases
Below is a full list of new/improved LogicModules as well as bug fixes that were implemented since our last release:
New LogicModules:
- Citrix Licensing– 1 DataSource / 1 PropertySource
Bug Fixes and Updates
- Riverbed Appliances
- Nimble Storage SSD/HDD Disks
- EMC Isilon Storage Node Disks
- Linux Disk Performance
- VMware vSphere Hosts
- VMware vSphere VirtualMachines
- VMware vSphere DatastoreCapacity
- VMware vSphere VMsnapshots
- VMware vSphere VMstatus
- Cisco NxOS ConfigSource
- Cisco IOS ConfigSource