
Disclaimer: This content applies to the legacy UI and is no longer maintained. It will be removed at a future time. For up-to-date content, see Ping Check. At the time of removal, you will automatically be redirected to the up-to-date content.
Adding a Ping Check
Last updated - 25 July, 2025
Overview
Ping Checks periodically ping a host name or IP address in order to verify that a device or website is up and listening. LogicMonitor supports two types of Ping Checks:
- Standard Ping Check. Standard Ping Checks, known simply as “Ping Checks” in the LogicMonitor interface, are performed by one or more geographically dispersed checkpoint locations. These locations are hosted by LogicMonitor and are external to your network. The purpose of a standard Ping Check is to verify that the outside world can reach the host name or IP address.
- Internal Ping Check. Internal Ping Checks are performed by one or more Collectors internal to your network. The purpose of an Internal Ping Check is to verify that the host name or IP address (whether internal or external to your network) is available to your network users.
The processes for creating standard Ping Checks and Internal Ping Checks are largely identical. This support article covers the addition of both types of checks, but will identify where configurations diverge, notably when identifying checkpoint locations.
Note: For information on the type of data that is monitored for your configured Ping Checks and how that data is organized on the Websites page, see What Is Website Monitoring?.
Configuring Basic Information
To begin the creation of a new Ping Check, select Websites | Add | Ping Check or Websites | Add | Internal Ping Check, depending upon whether you want the pings to be sent from locations external or internal to your network. In the Add dialog that opens, there are several pieces of basic information that must be provided, as shown (and discussed) next.
Note: Ping Checks can also be added using LogicMonitor’s API; see Using LogicMonitor’s REST API for more information.
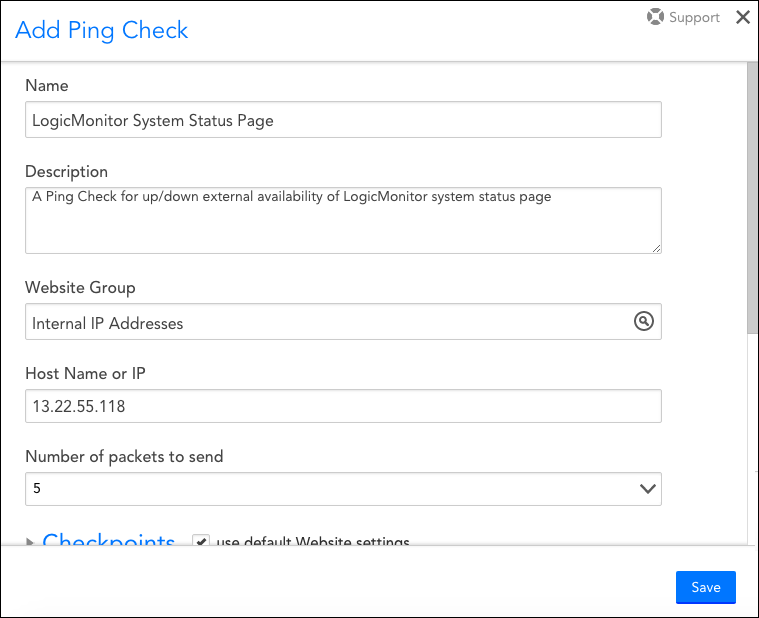
Name
In the Name field, enter a descriptive name for your new Ping Check.
Description
In the Description field, briefly describe the scope and purpose of your new Ping Check.
Website Group
From the Website Group field’s dropdown menu, select the group that the Ping Check should belong to from the list of existing groups. By default, the root (top-level) website group is selected.
Host Name or IP
In the Host Name or IP field, enter the host name or IP address to which the ping test will be sent.
Number of packets to send
From the Number of packets to send field’s dropdown menu, select the number of packets to send for the Ping Check. LogicMonitor defaults to five packets, but you can choose to send up to 50. Packets are sent one by one, with a delay of 250 milliseconds between each packet.
Configuring Checkpoints
In the Checkpoints section of the Add dialog, specify the locations from which ping requests should be sent. As discussed in the following two subsections, the types of locations that are available here vary depending upon whether you are adding a standard Ping Check or an Internal Ping Check.
Note: If you have default checkpoints established and want to use or build on those, leave the use default Website settings option checked. For more information on configuring default Website settings, see Website Default Settings.
External Checkpoints
If you are adding a standard Ping Check, there are five geographically dispersed checkpoints, hosted by LogicMonitor, from which the ping request can be sent.
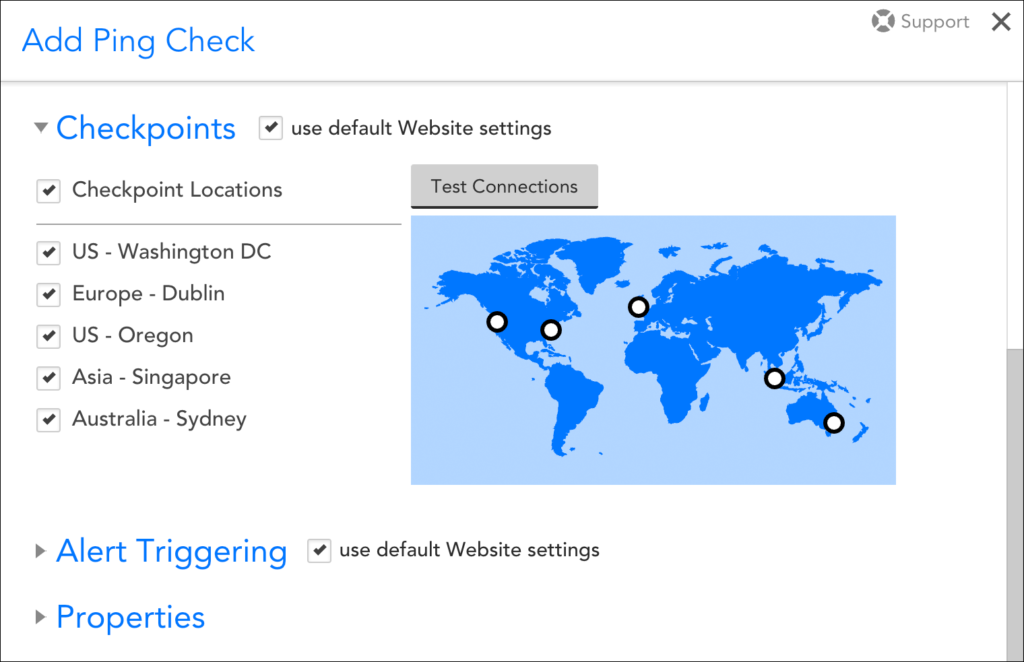
When you have finished selecting the external locations from which your ping requests will originate, click the Test button to verify that the selected locations can successfully ping the host name or IP address.
Internal Checkpoints
If you are adding an Internal Ping Check, you will need to specify the Collectors that will be sending the ping request. Click the + button to add Collectors to the table, as shown next.
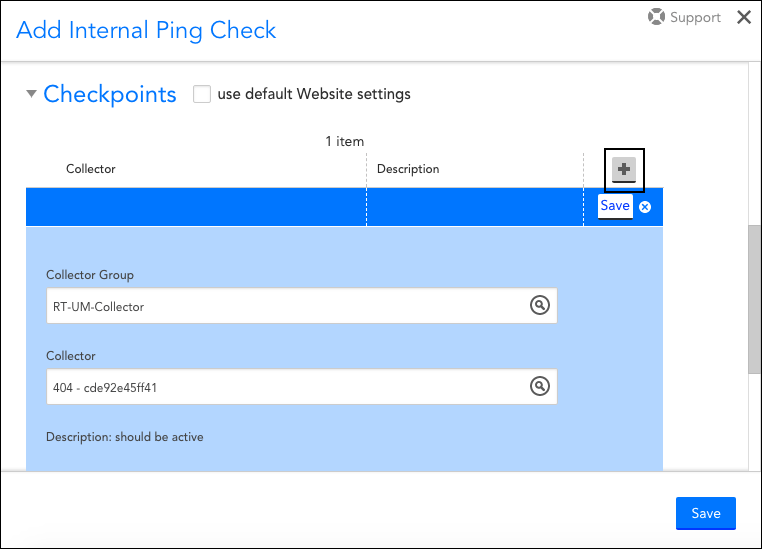
Note: As discussed in Roles, your user account must, at a minimum, have Collector view permissions in order for you to be able to view and select Collectors from this area of the dialog.
Configuring Alert Triggering
In the Alert Triggering section of the Add dialog, you will specify the conditions that must be met in order for a website alert to be triggered, as well as the severity of the resulting alert(s). There are several fields that require configuration in this section, as shown (and discussed) next.
Note: If you have default alert triggering settings established and want to use or build on those, leave the use default Website settings option checked. For more information on configuring default Website settings, see Website Default Settings.
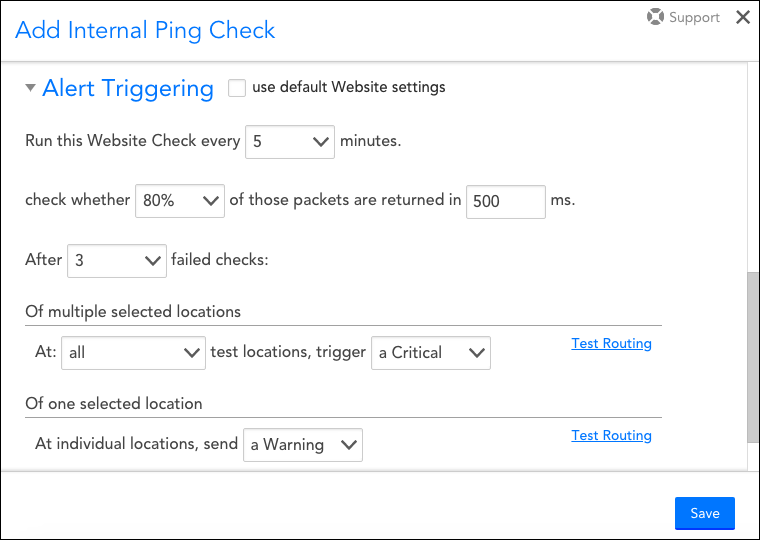
Run this Website Check every (X) minutes
From this field’s dropdown menu, select how often the designated checkpoints will ping the host name/IP address. You can choose from frequencies that range from once a minute to once every 10 minutes.
Check whether (X)% of those packets are returned in (X) ms
From the two fields in this configuration, designate the percentage of packets that must be returned and the designated time period (given in milliseconds) in order for the check to be deemed successful. Packets are sent one by one, with a delay of 250 milliseconds between each packet. For example, if you leave the default of five packets in the Number of packets to send field, it will take 1000 milliseconds (one second) to deliver all five packets.
Note: These two fields technically operate independently of each other. If either criterion is not met (for example, any returned packet takes longer than the minimum allowed return time OR the number of packets returned is less than the minimum percentage threshold), the check is considered a failed check.
After (X) failed checks…
From this field’s dropdown menu, select the number of consecutive checks that must fail in order for an alert to be triggered.
…Of multiple selected locations
This field piggybacks on the previous field. It gives you the ability to designate a different alert severity should ping requests from multiple checkpoints fail, as compared to the failure of just one checkpoint. For example, as shown in the previous screenshot, you could specify that if all checkpoints report failure for three consecutive checks, an alert with the severity level of critical will be triggered.
…Of one selected location
This field also piggybacks on the After (X) failed checks: field. It gives you the ability to designate a different alert severity should ping requests from only one checkpoint fail, as compared to the failure of multiple checkpoints. For example, as shown in the previous screenshot, you could specify that a failure at a single checkpoint location for three consecutive checks will trigger an alert with the severity level of warning.
Test Routing
Once you’ve configured the conditions that must be met in order for a website alert to be triggered, you can use the Test Routing hyperlinks to see what alert rule will match each condition, along with the escalation chain associated with that alert rule.
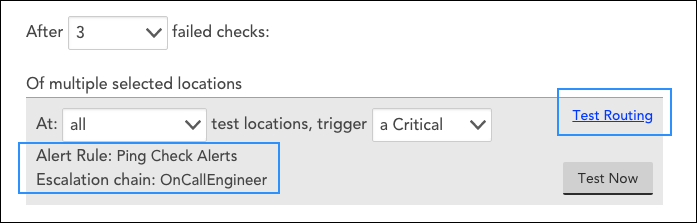
From the test display, the Test Now button can be used to send a synthetic test notification to the first stage in the specified escalation chain.
Note: Synthetic alert messages use LogicMonitor’s default global alert message templates. Any customizations such as addition of alert tokens will be ignored during testing. You must use a live alert to test customizations. For more information on alert message templates, see Alert Messages.
For more information on alert rules and their associated escalation chains, see Alert Rules.
Configuring Properties
Properties can be added to your Ping Checks to facilitate organization, customize alert message templates, and more. For more information on adding and using properties, see Website Properties.
