Edwin AI Event Intelligence Dashboard
Last updated - 12 February, 2026
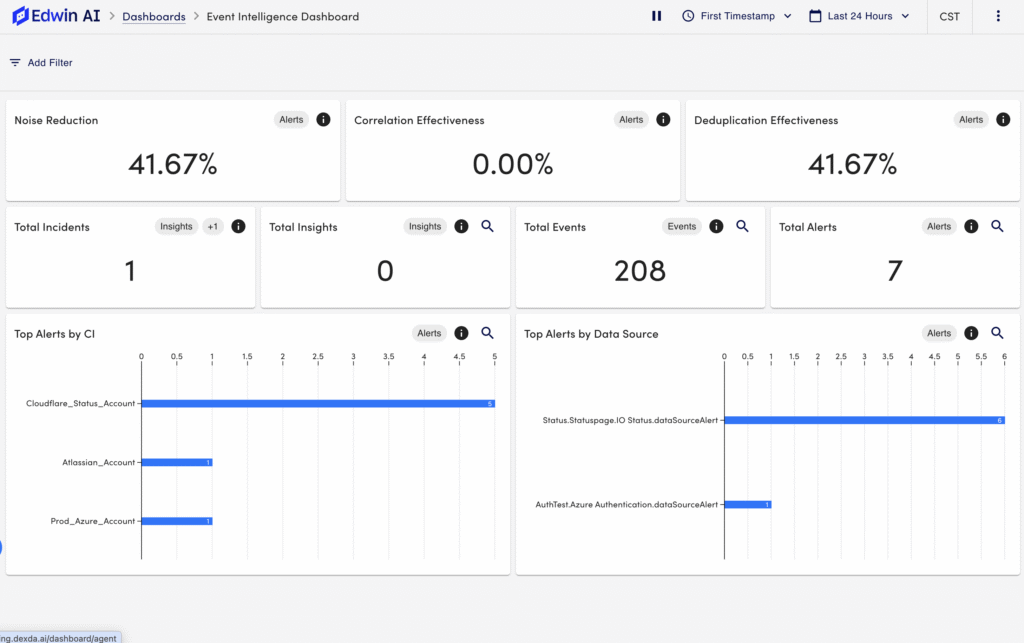
The Edwin AI Event Intelligence Dashboard provides a centralized view of alert and event activity and summarizes the impact of noise reduction, correlation, and deduplication (Event & Alert Intelligence capabilities).
You can use the Event Intelligence Dashboard to do the following:
- Understand the impact of event intelligence (noise reduction, correlation, and deduplication).
- Track incident and insight volume over time.
- Identify the highest-volume alert contributors by CI and by data source.
- Quickly filter the dashboard to a supported time range (including Last 90 days).
Visual Components of the Edwin AI Event Intelligence Dashboard
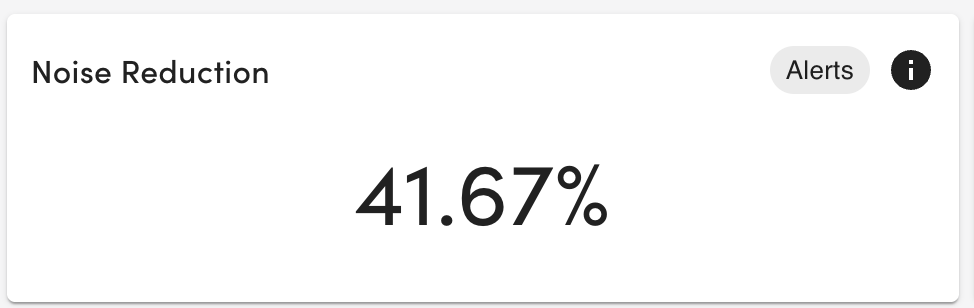
- Noise Reduction—Displays the number of insights and singletons divided by sum of de-duplicated events. This metric indicates the effectiveness of Edwin AI to reduce total IT operations work by applying correlation and de-duplication to minimize the number of records an IT operator must pay attention to.
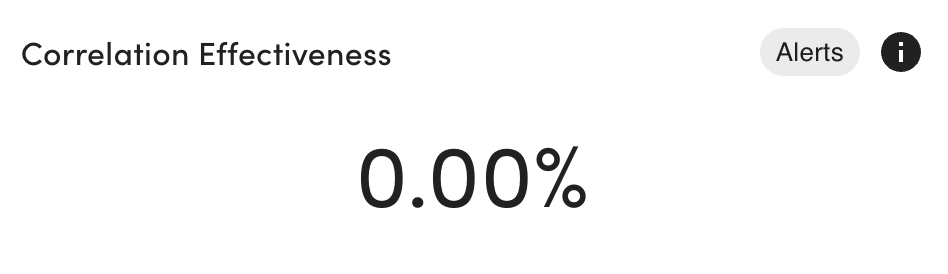
- Correlation Effectiveness—Displays the number of correlated alerts divided by the total number of alerts. This metric indicates the effectiveness of Edwin AI’s correlation models to group multiple alerts together into a correlation.
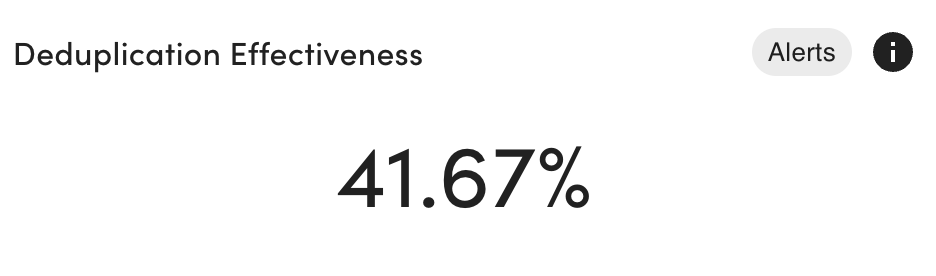
- Deduplication Effectiveness—Displays the number of alerts divided by sum of de-duplicated events. This metric indicates the effectiveness of Edwin to de-duplicate repeated identical events into a single alert and maintain state.
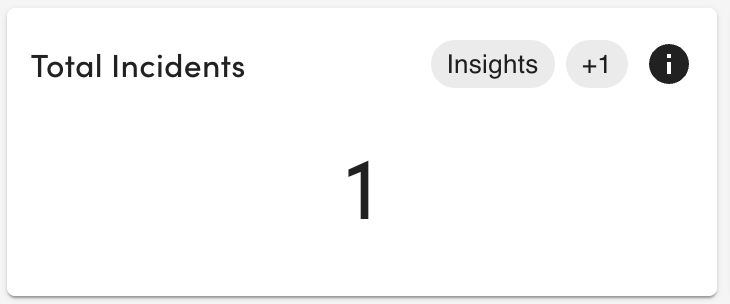
- Total Incidents—Displays the total number of incident tickets in the selected time range. This includes both alerts and insights.
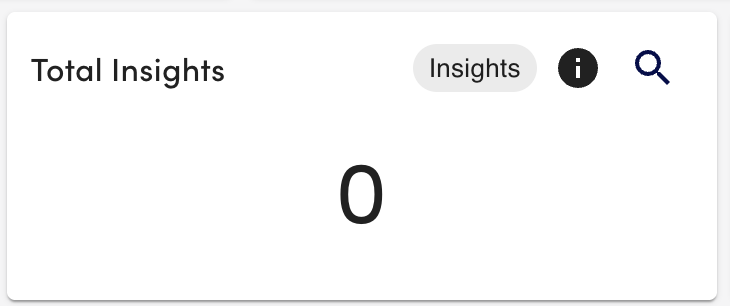
- Total Insights—Displays the total number of insights generated in the selected time range.
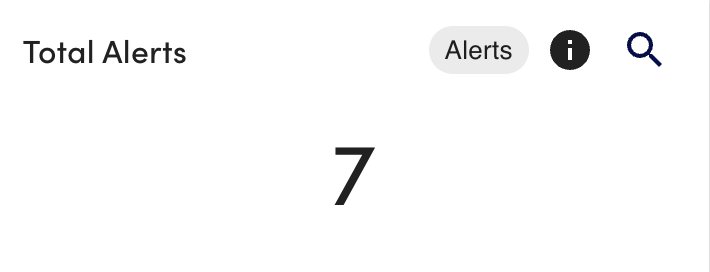
- Total Alerts—Displays the total number of alerts in the selected time range.
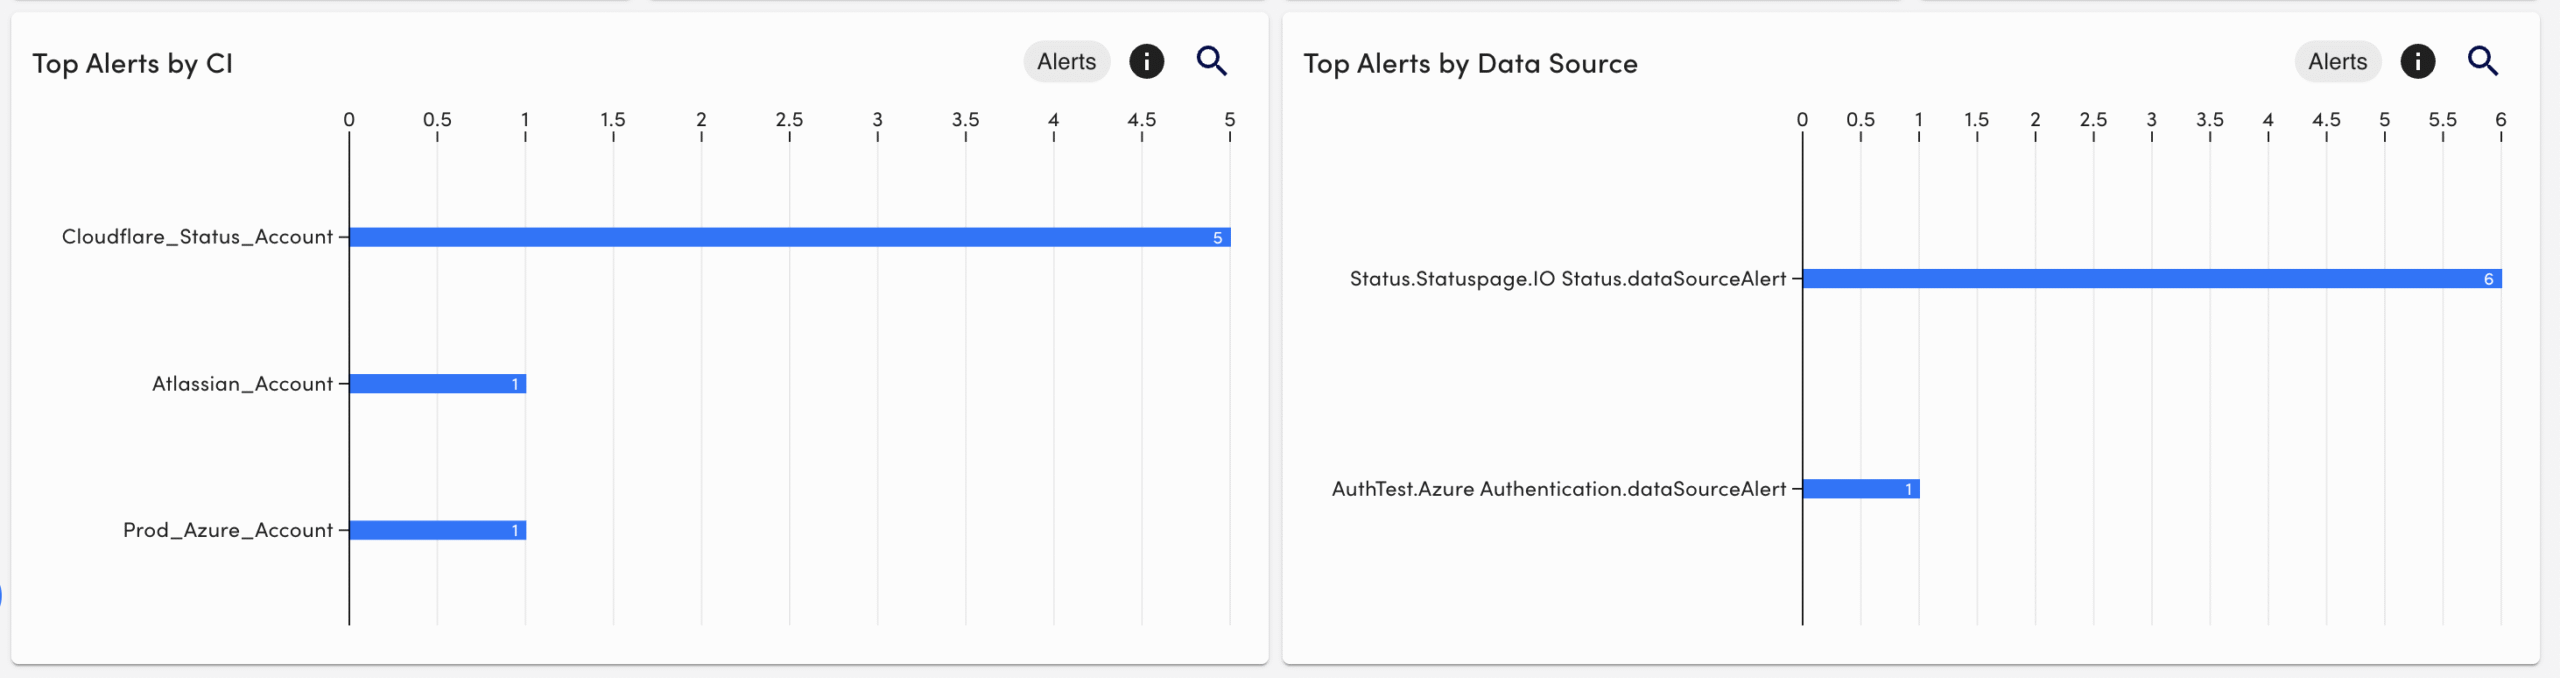
- Top Alerts —Identifies which integrated source is contributing the most alerts.
- Top Alerts by CI—Displays CIs with the most alerts
- Top Alerts by Data Source—Displays the “Name” or in other words, the datapoint-datasource, that generated the most alerts.