
Health Check Report
Last updated - 29 May, 2026
The LogicMonitor Health Check report provides a concise, data-driven assessment of your LogicMonitor portal, giving you clear visibility into alerting behavior, monitoring coverage, system health, and overall platform usage. It helps you understand how your environment is configured today and how closely it aligns with LogicMonitor best practices.
Designed as a strategic review tool, the Health Check Report helps you reduce alert noise, improve monitoring reliability, identify unused or misconfigured resources, strengthen security controls, and validate recent configuration changes. By reviewing real usage trends, you can better prioritize improvements, support planning discussions, and prepare for growth or operational reviews.
The Health Check report gathers and provides data on the following areas of your portal that are available for you to review:
Note: The number of entries for each area is limited to 100.
- Account Information—Displays information about your LogicMonitor account, including contact information and resource count for your portal.
- Security Settings—Displays information about the security configurations of your portal—such as the status of 2FA and session timeout.
- Alert Settings—Displays information about the alert settings in your portal—such as configured alert rules, escalation chains, and recipient groups.
- Collectors—Provides a count summary of total and down Collectors, as well as any Collectors experiencing issues. Collector names are also provided for Collectors that are down, do not have an escalation chain, do not have a failover configured, and or not monitoring itself.
- Integrations—Provides a count summary of the integrations in your portal, including those with recommendations. Additional details are also provided for each integration that do not have a description and are not enabled for clear status.
- LogicModules—Displays a list of modules that match the status information for modules that are installed and have an upgrade available and modules that are installed with a skipped upgrade.
- NetScan—Provides a count summary of total NetScans, scheduled NetScans, and unmonitored Resources. Additional details are also provided for scheduled NetScans and unmonitored Resources, such as name and description of each NetScan, and the ID and IP for unmonitored Resources.
- Users & Roles—Provides a count and list of users for users for the following categories:
- Users that do not have 2FA enabled
- Users that are suspended
- Inactive users (for 90 or more days)
- Roles that are not assigned to any user
Additional information about each user is provided for suspended and inactive users. For example, the user’s first and last name (if available) and the last login date.
- Alerts—Provides details—such as the name, count, and percentage—on alert severity status and a list of the top five resources or LogicModules with an error, warning, or critical alert. Additional details are also provided for the outstanding critical alerts, including the alert ID and the Resource name.
- Resource & Resource Groups—Provides a count of resources that do not belong to a Resource group and a summary of details for Resources in your portal—such as total Resources, Resources with alerting disabled, and Resources with recommendations.
- Websites—Provides a count summary for Website and Website group details—such as total Websites, Websites with alerting disabled, and Websites with recommendations.
Requirements for Configuring a Health Check Report
To configure a Health Check report, you need a user with “View” and “Manage” for the Reports role permissions. For more information, see Reports Role Permissions.
Configuring a Health Check Report
- In LogicMonitor, navigate to Reports.
- Select
 > Add Report > select Add for the Health Check report.
- In the Name field, enter a name for the report.
Report names cannot include the operators and comparison functions used in LogicMonitor’s datapoint expression syntax. - (Optional) In the Description field, enter a description for the report.
For example, you can enter a description of the specific purpose of the report. - From Report Group, select the report group where your report is stored.
Matching groups display as you type, and you can select the group from the list. - From Format, select the type of format for the output of the report.
You can select HTML, PDF, or CSV.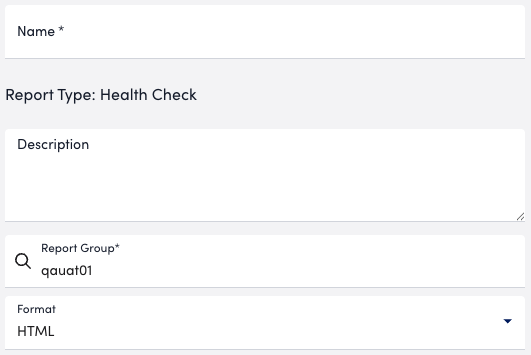
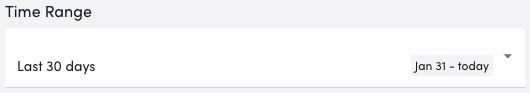
- From the Time Range dropdown, select the time range you want to base the report on.
- In the Report Schedule section, do the following to configure the report to generate on a schedule:
- oggle the Generate this report on a schedule switch.
- From the Frequency dropdown menu, select how frequent you want the report to generate, and then configure when you want the report to generate.
For example, if you configure the report to generate daily, you can choose the time to generate the report each day. If you configure the report to generate weekly, you can choose the day of the week and time to generate the report for the selected date. If you configure the report to generate monthly, you can configure the day of the month and time to generate the report.
Each frequency option provides you a setting for selecting the time zone. - In Recipients Email, enter the name of the user you want to receive the generated report.
You can also add recipient groups.
You can enter as many users as needed.
LogicMonitor attempts to match values as you type.
The recipients you add to the report are emailed a generated report based on the format you configured and the email associated with the username.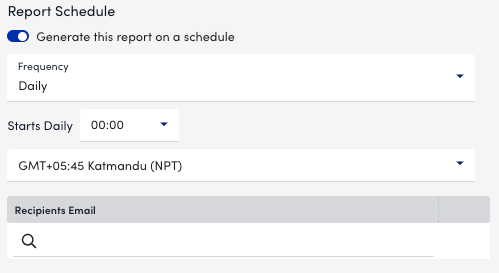
- Do one of the following to save the report:
- Select Save.
The report saves to the Report Group you selected.
If you configured the report to generate on a schedule, the report generates and sends to recipients based on the frequency you configured. - Select Save and Run.
The report saves to the Report Group you selected and generates a report based on the format you configured.
If you configured the report to generate on a schedule, the report generates and sends to recipients based on the frequency you configured.
- Select Save.
Important: The maximum limit for generating the Health Check report is 50. You must wait for 24 hours to generate the next report or contact your system administrator.
