


Highlights
- Feature Highlights: Added enhanced monitoring for Lambda Insights and AWS ECS Container Insights, new Maps and Graphs tabs available on the Alerts page. Released Argus v7.0.0
- General Updates: Added the ability to automatically expand log messages, added the ability to view the display name and ERT when hovering over a node, and the Maps and Graphs Alert Analysis tabs are now available for all users.
- Updated Monitoring: Added new monitoring for Zoom rooms, additional monitoring for Cisco APIC, and new coverage for Cisco ISIS devices.
Feature Highlights
Enhanced Monitoring for Lambda Insights and AWS ECS Container Insights
- You can now collect Lambda Insights metrics for AWS Lambda functions that have Lambda Insights’ Enhanced Monitoring enabled. To start collecting this data, import the AWS_Lambda_Insights DataSource.
- You can now collect AWS ECS Container Insights metrics to view how applications are performing down to the task family level. To start collecting this data, import the AWS_ECS_ContainerInsights and AWS_ECS_ContainerInsights_TaskFamily DataSources and ensure that Container Insights is enabled on the ECS cluster for which you want to view metrics.
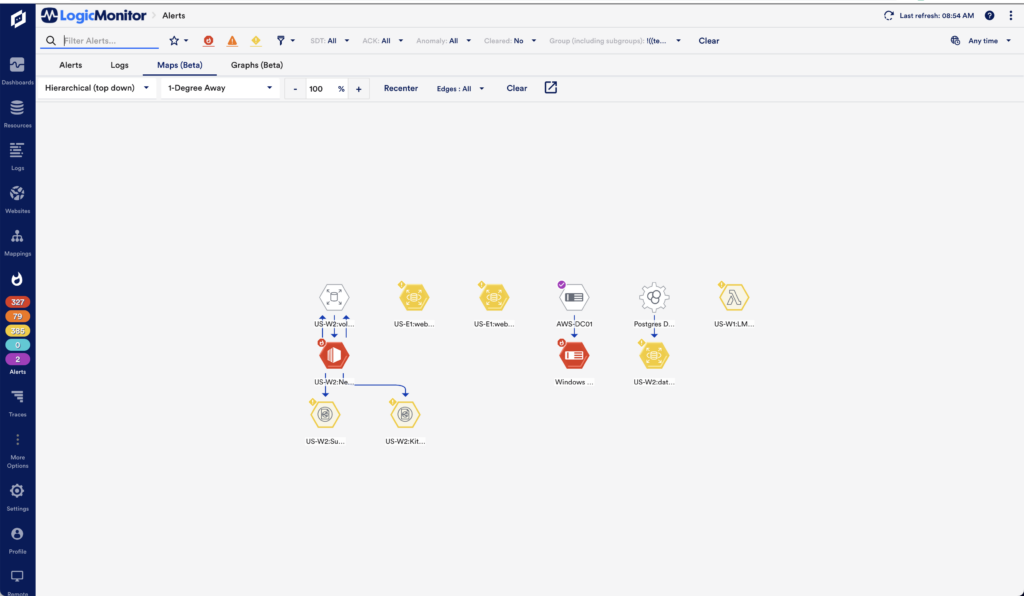
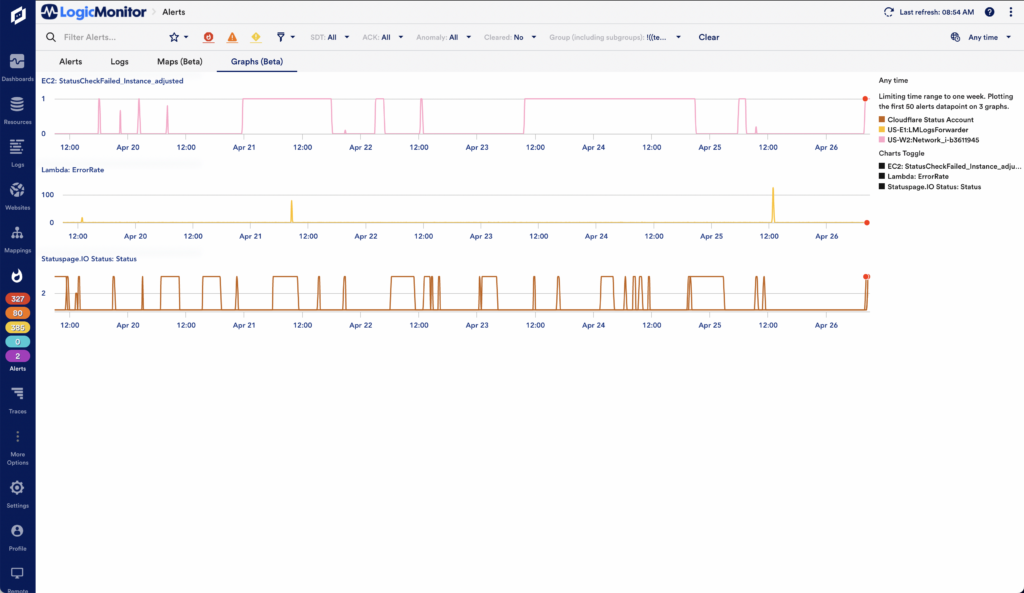
New Maps and Graphs Tabs on the Alerts Page
The Maps and Graphs tabs on the Alerts page will be available for all users starting on May 2nd. These tabs streamline troubleshooting and root cause analysis by showing you the information at a glance, without requiring you to click into each alert.
General Updates
Container Monitoring
Enhancements
- Updated the display names of the kube-state-metrics based LogicModules in order to make them more consistent with the rest of the modules in LM Exchange.
- The ability to add a Kubernetes cluster has been restricted to users with Administrator privileges or users that have “Manage” permissions for at least one device group.
- Added a new dashboard for the following resources based on the metrics received from the KSM integration:
- Daemonsets
- Replicasets
- Persistent volumes
- Statefulsets
For more information, see Monitoring Kubernetes Clusters with kube-state-metrics
Argus v7.0.0 was released with the following updates:
- Supports Kubernetes (K8S) 1.23 and the latest GoLang libraries along with:
- Argus Image v7.0.0 and Helm Charts 2.0.0
- Collectorset-controller Image v3.0.0 and Helm Charts 1.0.0.
For more information see, About LogicMonitor’s Kubernetes Monitoring and Upgrading Kubernetes Monitoring Applications.
- Enabled new Resource tree default view with Argus helm chart version 2.0.0 and Argus version v7.
For more information, see Updating Kubernetes Resource Tree. - Added a new LogicModule to support Persistent Volume Claim and Endpoint Monitoring.
- Added a Kubernetes selector to the LogicMonitor portal as properties so it can be easily used for filtering with the selector in cluster and dynamic group creation based on selector filters.
Bug Fixes
- Fixed an issue where the Pods that had status as complete were not getting deleted.
- Fixed an issue that caused false 0 replica count alerts raised by LogicMonitor when Kubernetes performed an update on a ReplicaSet by scaling the old ReplicaSet to 0 and bringing up a new ReplicaSet.
LM Cloud
Enhancements
- Added support for Azure PostgreSQL collection via Flexible Server deployment monitoring.
- Added support for Azure Postgres DB Flexible Server deployments to the Collector Assignments tab.
- Added support for monitoring GCP devices in the following regions:
- us-west3
- us-west4
- northamerica-northeast2
- southamerica-west1
- asia-south2
- asia-southeast2
- asia-east2
- asia-northeast2
- asia-northeast3
- australia-southeast2
Bug Fixes
- Fixed an issue that prevented the azure.country value from displaying properly in the Cloud Account information.
LM APM
Enhancements
- Updated the authentication method in the OpenTelemetry Collector wizard from Bearer tokens to LMv1 tokens. Existing Collectors will still be supported but you will need to leverage users with LMv1 tokens with the minimum set of required permissions in order to create an OTEL Collector.
Bug Fixes
- Fixed an issue where the Traces page was not viewable by users with Administrator privileges in new trial accounts.
LM Logs
Enhancements
- Added the ability to automatically expand all log messages using the Wrap Text setting in the Appearances options.
- Updated the LM Logs Azure script deployment template to allow a non-US region to be selected.
Topology
Enhancements
- Added the ability to view the display name and ERT when hovering over a node. In addition, you can now move the map around when a node is selected in all layout modes except dynamic.
User Interface
Bug Fixes
- Fixed an issue that prevented some device properties from displaying on the Devices page.
- Fixed an issue with inconsistent column names between HTML and CSV formatted reports. For the Resource Metric Trend Report, the column name in CSV format was changed from “Device” to “Resource” to match the HTML format.
LogicModule Releases
New and updated LogicModules are available for you to import from the LogicMonitor Public Repository. This section lists the LogicModules that are new in this release, updated in this release, or will be removed in a future release. Changes related to the LogicModule feature will be listed under General Updates.
New LogicModules
| LogicModule Name | Details |
| (1 DataSource) LogicMonitor_Collector_Snippets | Added new monitoring for module snippets. This module also updates Collectors running older versions that resulted in snippet loading errors. |
| (1 PropertySource) addERI_Cisco_ISIS (1 TopologySource) Cisco_ISIS_Topology | Added new topology coverage for Cisco ISIS devices. |
| (2 DataSource) SaaS_Zoom_RoomIssues SaaS_Zoom_RoomStatus | Added new SaaS monitoring for Zoom Rooms. |
| (8 DataSources) Cisco_APIC_ApplicationProfiles Cisco_APIC_BGP Cisco_APIC_BridgeDomains Cisco_APIC_Capacity Cisco_APIC_ClusterStatus Cisco_APIC_EndpointGroups Cisco_APIC_Fans Cisco_APIC_Tenants | Added new monitoring for various aspects of Cisco APIC. |
| (3 PropertySources) Config_Arista_Generic Config_Aruba_Generic Config_PaloAlto_Generic | Added common ConfigSources for Arista, Aruba, and Palo Alto devices. |
| (2 DataSources) Kubernetes_KSM_EndPoints Kubernetes_KSM_PersistentVolumeClaims | Added support for monitoring endpoints and persistent volume claims. |
Updated LogicModules
| LogicModule Name | Details |
| (1 PropertySource) addCategory_TopoSwitch (1 TopologySource) Networking_L2_snmpSwitch | Decreased the VLAN bridge extraction timeout to 2000ms. |
| (5 DataSources) DellEMC_PowerStore_ClusterCapacity DellEMC_PowerStore_EthernetPort DellEMC_PowerStore_FibreChannelPort DellEMC_PowerStore_Nodes DellEMC_PowerStore_VolumeCapacity (1 PropertySource) addCategory_DellEMC_PowerStore (1 EventSource) PowerStore Alerts | Fixed an issue that caused AD to fail for ClusterCapacity due to a difference in how the API endpoint handled parameters. Updated all modules to follow best practices in parameter handling for API calls. |
| (3 DataSources) Cisco_DNAC_Clients Cisco_DNAC_Devices Cisco_DNAC_Networks (1 PropertySource) addCategory_Cisco_DNAC (1 TopologySource) Cisco_DNAC_Topology (1 EventSource) Cisco DNAC Issues | Fixed a token handling issue that caused data gaps. |
| (1 DataSource) PaloAlto_FW_GlobalSessions | Updated the description and tech notes. |
| (1 DataSource) Cisco_Meraki_Switch_Interfaces | Updated the Throughput graph and removed unneeded virtual datapoint. |
| (1 PropertySource) addERI_ISIS | Adjusted to account for Cisco having separate OIDs for ISIS. |
| (1 TopologySource) Networking_L2_snmpSwitch | Updated to link to VM macs if over 75%. |
| (21 PropertySources) addCategory_ArubaOIDComp addCategory_CiscoCUCMAPI addCategory_Cisco_APIC addCategory_Cisco_Multicast addCategory_Cisco_Multicast_Routes addCategory_Dell_DRAC addCategory_EMCUnity addCategory_F5GTM addCategory_InfobloxDHCP addCategory_Isilon addCategory_Linux_SSH addCategory_Lync addCategory_NetApp_ESeries addCategory_NetscalersActive addCategory_NimbleSSH addCategory_Rubrik addCategory_Ruckus_SZ_ClusterMode addCategory_SilverPeak addCategory_SonicWallFW addCategory_SyntheticsCollector addCategory_VMAX | Updated to exclude devices that already have the associated property in AppliesTo to prevent extra runs on the Collector. |
| (1 DataSource) VMware_vSphere_VMperformance | Added an overview graph. |
| (2 DataSources) Cisco_UCS_PSUs Cisco_UCS_Ports | Updated a complex datapoint to account for the admin state. Added new datapoints for PSU metrics. |
| (5 DataSources) DellEMC_PowerStore_ClusterCapacity DellEMC_PowerStore_EthernetPort DellEMC_PowerStore_FibreChannelPort DellEMC_PowerStore_Nodes DellEMC_PowerStore_VolumeCapacity (1 PropertySource) addCategory_DellEMC_PowerStore (1 EventSource) PowerStore Alerts | Fixed an issue that caused AD to fail for ClusterCapacity due to a difference in how the API endpoint handles parameters. Updated all modules to follow best practices in parameter handling for API calls. |
| (9 DataSources) SAP_HANA_BackupAge SAP_HANA_Connections SAP_HANA_DatabaseMemoryUse SAP_HANA_DiskUsage SAP_HANA_HostResourceUtilization SAP_HANA_ServiceStatus SAP_HANA_SystemDatabaseAvailability SAP_HANA_TableSizeOnDisk SAP_HANA_Troubleshooter | Fixed an issue that prevented connection for some users. |
| (1 DataSource) Kubernetes_ControlPlane | Removed dependency on the component status API (deprecated since Kubernetes v1.19) for health checks of etcd, kube-controller-manager, and kube-scheduler. Restricted AppliesTo to Kubernetes Pods. |
| (1 DataSource) Kubernetes_KSM_Replicasets | Added new datapoint expectedReadyReplicas with alerting. |
| (1 PropertySource) Device_BasicInfo | Added null checks for serial number checks to account for devices that have the serial number listed in later OIDs. |
| (8 DataSources) Cisco_APIC_CPU Cisco_APIC_FabricNodeHealth Cisco_APIC_FabricPodHealth Cisco_APIC_Hypervisor Cisco_APIC_Interfaces Cisco_APIC_Memory Cisco_APIC_ProcessesContainers Cisco_APIC_Storage | Updated to bring modules to current standards and consistency with the rest of the package. Note: History will be lost for the datapoint entries_aged in Cisco_APIC_Interfaces. The data collected previously was inaccurate. |
| (1 DataSource) Kubernetes_KSM_Replicasets | Added the new expectedReadyReplicas datapoint. |
Looking Ahead
In this section, you will find announcements about upcoming beta features, updates about ongoing beta features, and information about the end-of-life of existing features.
Azure China Regions Monitoring Beta
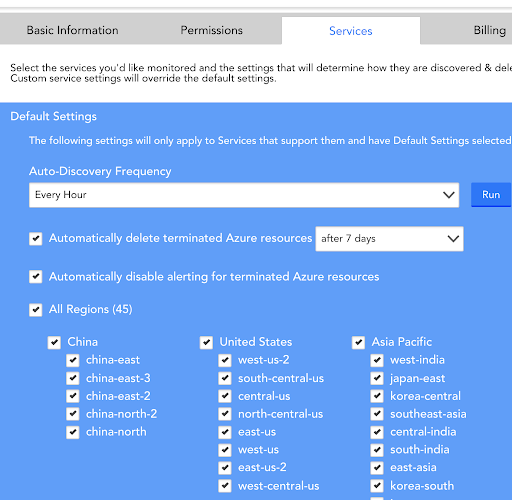
Beginning with v168, select users can opt-in and start monitoring their Azure China Cloud accounts. Contact LogicMonitor Support to enable this beta feature for your LogicMonitor portal. After the feature has been enabled, you must add a new Cloud account to be tied to your China-hosted region using the Cloud Account (Legacy) option and select the China account checkbox on the Permissions tab. On the Services tab, select the China regions you want to monitor. If you need additional assistance, contact LogicMonitor Support.
Old Alert Page Deprecation Notice
Support for the old Alert page (https://accountname.logicmonitor.com/santaba/uiv4/alert) has been removed. Issues related to the old Alert page are no longer being addressed and access to the page will be removed with an upcoming release.
To ensure that you are using the most up-to-date Alerts page, click Alerts in the LogicMonitor Navigation sidebar or append “/uiv4/alerts” to your LogicMonitor URL.
