
Disclaimer: This content applies to the legacy UI and is no longer maintained. It will be removed at a future time. For up-to-date content, see Website Status Widget. At the time of removal, you will automatically be redirected to the up-to-date content.
Website Status Widget
Last updated - 24 July, 2025
The Website Status widget displays the status of multiple testing locations verifying the availability for either one or multiple websites. Each line in the graph represents a specific testing location status.
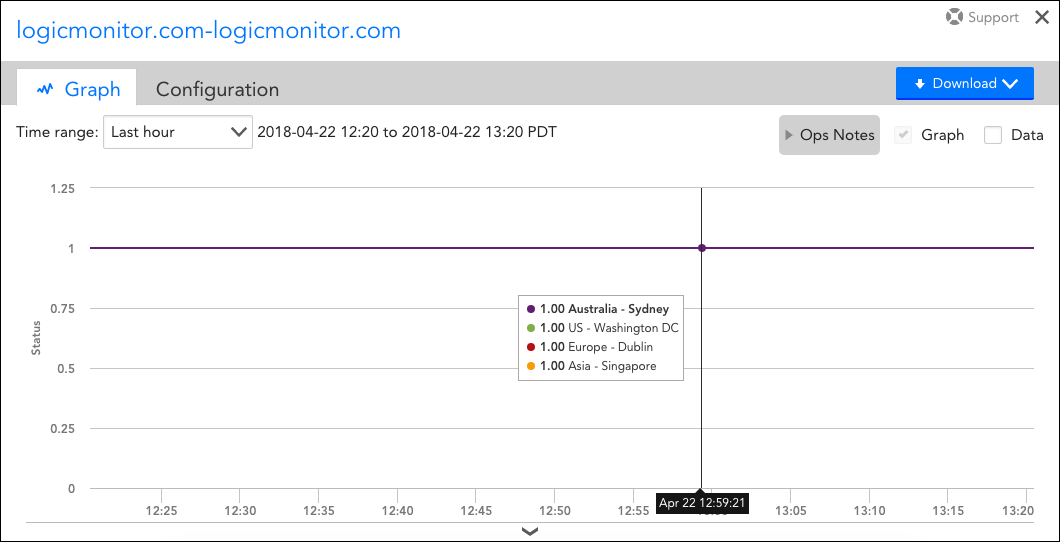
The above screenshot displays the individual statuses of the LogicMonitor website from all selected external testing locations.
Creating a Website Status Widget
To create a Website Status widget, open the dashboard you would like it to display on and either click Add | Widget | Website Status from the Dashboard tree or click the drop-down arrow (v) icon located in the far right of the open dashboard’s header and click Add Widget | Website Status. This opens the Add Website Status Widget dialog, which is divided into three configuration categories:
- Basic Information
- Website Individual/Overall Status Options
- Widget Appearance
Basic Information
For instructions on completing the first few universal fields displayed at the top of the Add Website Status Widget dialog (i.e. Widget Title, Description, and Refresh Frequency), see Adding and Configuring Widgets.
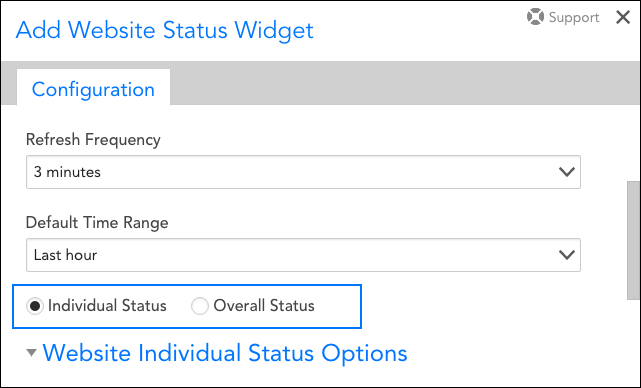
Default Time Range
From the Default Time Range field’s drop-down menu, specify the length of time over which you would like website status to be represented by the graph.
Individual or Overall Status
Select either the Individual Status or Overall Status option. Individual status displays the status of multiple testing locations for one website; each line in the graph represents a specific testing location. Overall status displays the status of multiple websites in one graph; each line in the graph represents a specific website.
Website Individual/Overall Status Options
The second configuration category on the Add Website Status Widget offers different configurations based upon whether you selected the Individual Status or Overall Status option above. The two variations are discussed next.
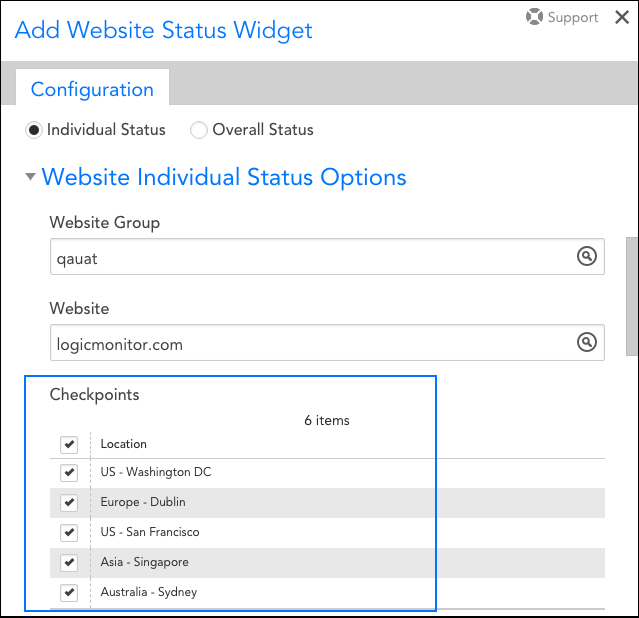
Website Individual Status Options
When graphing a website’s individual status (i.e. graphing the status of multiple testing locations for one website), the following fields are available for configuration.
Website Group
From the Website Group field’s drop-down menu, select the website group to which the website belongs. A specific value from the drop-down menu is required.
Website
From the Website field’s drop-down menu, select the website you would like to graph. A specific value from the drop-down menu is required.
Checkpoints
Select one or more checkpoints. The status for each testing location selected will display as a separate line in the widget’s graph.
Website Overall Status Options
When graphing multiple websites’ statuses (i.e. each line in the graph represents a specific website), the following fields are available for configuration.
Group/Website
Click the + button to add a website to your widget’s graph display. The Group field’s value filters the values available under the Website field’s drop-down menu.
You will notice that the Group field auto-populates with the ##defaultWebsiteGroup## token. If you leave this default value in place, your widget will populate with the website group information specified at the token’s dashboard level. If you are not using dashboard tokens, you can simply delete this default value and select the website group of your choosing. For more information on dashboard tokens, see the Using Dashboard Tokens section in the Creating Dashboards support article.
Check the Exclude SDT periods option if you do not want scheduled downtimes to impact your website’s status display.
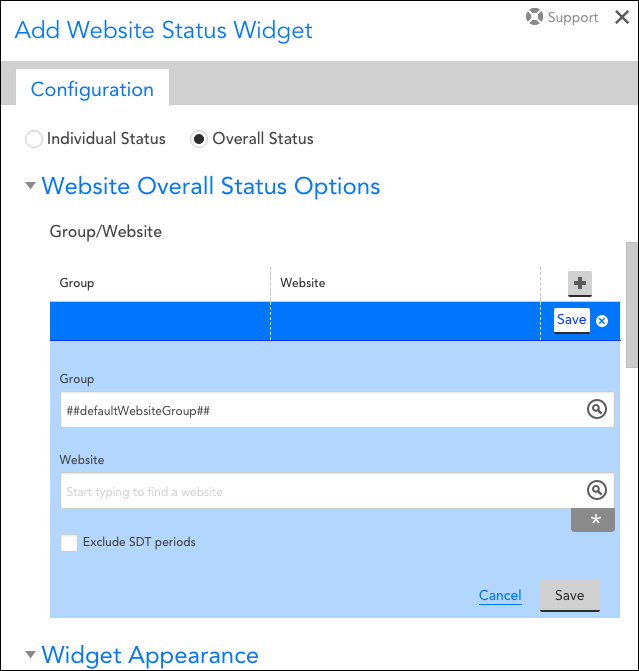
After selecting a website group, website, and what impact SDTs have on the display, click the Save button to save the website as one line of your widget’s graph display. To begin again with another website, click the + button.
Widget Appearance
As with the first few universal fields displayed at the top of the Add Website Status Widget dialog, the Color Schema field is also common across widgets. For more information on this field, see Adding and Configuring Widgets.
