
6. Understanding LogicMonitor alerts
Last updated - 23 July, 2025
LogicMonitor alerts will tell you when there is an issue or a future issue within your infrastructure.
What does LogicMonitor alert on?
LogicMonitor can alert on:
- DataSources
- ConfigSources
- EventSources
- Web Checks
- Collector down, failover, and failback
- JobMonitors
- Host clusters
DataSource alerts are the most common, and these alerts are based on the values that a LogicMonitor collector is receiving from your devices. A DataSource alert is triggered when threshold criteria for a datapoint are met:
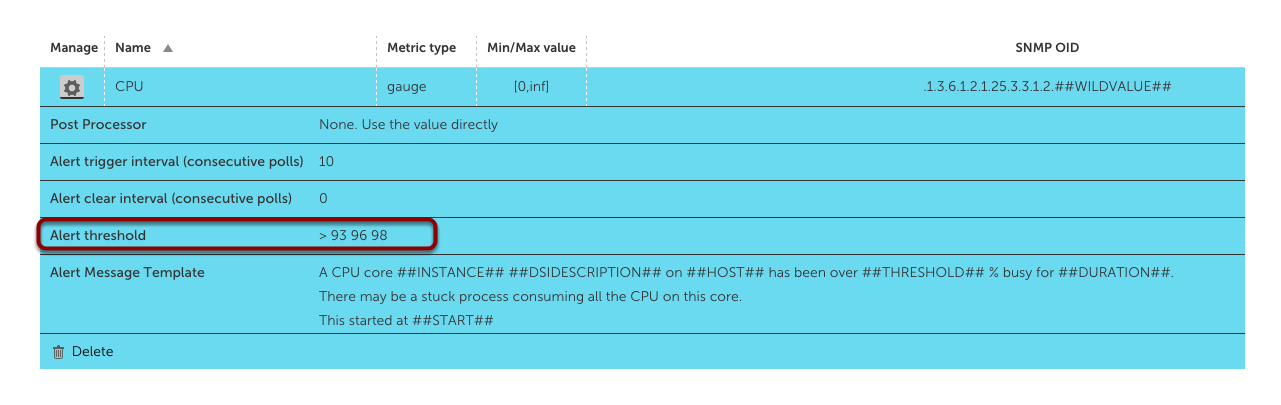
Remember that datapoints are the metrics being monitored for a particular DataSource. Each datapoint can have three static thresholds—one for each of LogicMonitor’s three alert severity levels. The alert trigger interval and alert clear interval for a datapoint indicate how many polling intervals the datapoint value must meet the threshold in order for the alert to trigger, or fail to meet the threshold in order for the alert to clear, respectively.
What do the different alert severities mean?
Critical Alerts indicate a worst-case scenario—something in wrong in your infrastructure and needs to be fixed. These alerts are designed to be reactive alerts, meaning you should route them to the right team members and react to them as soon as possible.
Error Alerts indicate that something in your infrastructure is wrong or isn’t behaving normally, but there may not be a specific action that has to be taken to fix it. You want to know about error alert issues, but they don’t have the same sense of urgency that critical alerts have.
Warning Alerts indicate that there is a potential issue in your infrastructure that you want to be aware of, but it may not be causing a problem yet. Warning alerts are designed to usually be proactive alerts, meaning LogicMonitor is telling you that there may be a future problem. You typically don’t need to route these alerts for immediate action—instead they are best reviewed periodically in LogicMonitor reports. Reports can show you where your noise is coming from and help you figure out if there are alerts that you want to route to email or SMS messages.
Most LogicMonitor DataSources come with pre-configured default static thresholds, so alerts will be triggered right out of the box. However, LogicMonitor’s critical may not match your critical—we recommend that you adjust these thresholds to better fit your use case.
