
v.130 Release: Retirement of Old Alerts Page UI; New Monitoring for OpenMetrics Data
Last updated on 14 September, 2022Happy New Year! LogicMonitor has a lot of exciting initiatives planned for 2020 and we’re hitting the ground running. Rolling out through early February, our first release of the year features improved alert display, a template for monitoring data in open source OpenMetrics format (previously known as Prometheus), and new out-of-the-box monitoring for Azure backup jobs (available once release is fully rolled out), AWS CloudSearch domains, GCP Dataproc clusters, Cisco HyperFlex, and others.
HEADS UP! After running in parallel with the new Alerts page UI for 90 days, the old Alerts page UI is retiring with v.130. The temporary toggle that allowed navigation between the new and old UI is removed, leaving only the new Alerts page UI accessible. The new Alerts page does not support Microsoft Internet Explorer 11. If you are using IE11, we strongly recommend that you move to a supported LogicMonitor browser as soon as possible to avoid any disruptions in your monitoring operations.
IN THIS RELEASE:
- New and Updated Monitoring Coverage: OpenMetrics exposition format, numerous new cloud services including Azure backup jobs (available once release is fully rolled out), and Cisco HyperFlex
- Other v.130 Enhancements: Text wrapping in alert table; new calculation available for the Resource Metrics Trends report
- Looking Ahead: Integrations page
New and Updated Monitoring Coverage
Upon your account’s upgrade to v.130, import our new and updated LogicModules from the LogicMonitor repository to expand and enhance your monitoring coverage.
New Monitoring Coverage
- AWS CloudSearch Domain – 1 DataSource
- Discovers AWS CloudSearch domains and monitors domain performance metrics including the number of search requests successfully processed, the number of searchable documents, and the index capacity utilization (as reported by CloudWatch).
- AWS Glue Job – 1 DataSource
- Discovers and monitors AWS Glue job performance metrics as reported by CloudWatch.
- Cisco HyperFlex – 15 DataSources, 2 PropertySources
- Using the HyperFlex REST API, LogicMonitor’s Cisco HyperFlex monitoring package monitors a variety of metrics for Cisco’s hyper-converged infrastructure (HCI) platform. See Cisco HyperFlex Monitoring for details on what is monitored, as well as instructions for setting up monitoring.
- GCP Cloud Dataproc Cluster – 1 DataSource
- Discovers GCP Dataproc clusters and monitors cluster metrics including storage capacity, utilization, and job data.
- GCP Cloud Filestore Instance – 1 DataSource
- Discovers GCP Cloud Filestore instances and monitors storage metrics including free disk space, disk IOPs, and storage utilization.
- Microsoft Azure Backup Job – 1 DataSource
- Discovers and monitors Azure backup jobs within Azure recovery vaults. Note: The Azure Backup Job DataSource will be available once release is fully rolled out (early February).
- Microsoft Azure Batch Account – 1 DataSource
- Discovers Azure Batch service and monitors batch metrics including node performance, task count, task completion, jobs, and pools.
- Microsoft Azure Network Interface – 1 DataSource
- Discovers Azure network interfaces and monitors sent/received metrics for bytes and packets.
- OpenMetrics – 2 DataSources
- Gathers metrics from systems, like Telegraf, that expose metrics in open source OpenMetrics format (previously known as Prometheus). Because OpenMetrics data can represent any number of metrics from any number of resources, these DataSources are templates that require cloning and customization. For more details, see OpenMetrics Monitoring.
- Topology mapping New TopologySource – 1 TopologySource
- New Networking_L2_snmpSwitch_Peak created to improve topology mapping and related root cause analysis operations.
Updated Monitoring Coverage
- AWS Classic ELB Service Limits – 1 DataSource
- Updated the ListenersPercentUsage complex datapoint to reflect aggregate load balancer limits; added some clarifications to datapoint descriptions and alerts.
- AWS EC2 T2 Instance Credits – 1 DataSource
- Updated AppliesTo logic to ensure that credits are only applied to appropriate EC2 instances (i.e. instances that are not in unlimited credit mode).
- Cisco CPU – 1 DataSource
- Added new overview graphs; made various improvements to datapoints.
- Cisco UCS – 1 SNMP SysOID Map
- Added missing sysOIDs to extend support for Cisco UCS.
- ConnectWise – All DataSources (14 total) that use ConnectWise’s REST API (as compared to its legacy SOAP API)
- Fixed issue of missing clientID token in subsequent requests.
- Dell DRAC Temperature – 1 DataSource
- Updated the ErrorTemperature and Warning Temperature complex datapoints to remove unkwn() from expressions.
- EMC Avamar Client Backups – 1 DataSource
- Updated to auto-delete inactive instances after 30 days to prevent No Data alerts on inactive instances.
- EMC Avamar Data Domains – 1 DataSource
- Fixed incorrect variable binding issue in collection script.
- EMC Storage Pools – 1 DataSource
- Fixed issue with wildvalue that was preventing proper data collection; made various improvements to graphs and datapoints.
- EMC Unity [Host Initiators | Pools] – 2 DataSources
- Made updates to work around API calls that were deprecated with version 5.0.
- HP 3PAR Disks – 1 DataSource
- Fixed issue in collection script to address null object error.
- HP System CPU – 1 DataSource
- Fixed issue in Active Discovery script that prevented all CPU instances from being discovered.
- Ironport – 1 SNMP SysOID Map
- Corrected sysOID mismatch preventing “Ironport” from being added as a value to the system.categories property for Cisco Ironport devices.
- Juniper Component State – 1 DataSource
- Updated the alert threshold and alert message for the State datapoint.
- Juniper JUNOS – 1 ConfigSource
- Added timeout and retry logic to the collection script.
- Kubernetes Control Plane Azure – 1 DataSource
- Disabled alerting for this DataSource until known external issue is resolved. Learn more about this issue on the Azure Kubernetes Service (AKS) GitHub issue page.
- Kubernetes [Deployment | Service] – 2 DataSources
- Fixed issue caused by pods without labels.
- Linux New Processes – 1 DataSource
- Added missing datapoint descriptions; improved graph display.
- Linux SSH CPU/Memory – 1 DataSource
- Extended support for memory metrics for RHEL.
- Linux SSH Filesystems – 1 DataSource
- Fixed issue with collection script regex expression.
- LogicMonitor Collector Buffer Data Reporter Latency – 1 DataSource
- Fixed an issue with minimum latency reporting (Collector version EA28.100 or higher is required for minimum latency reporting to work properly).
- Microsoft Exchange – 1 PropertySource
- Fixed typo in script for the addCategory_MicrosoftExchange PropertySource.
- NetApp – 1 PropertySource
- The addCategory_NetApp PropertySource now looks for the existence of NetApp credential properties on a host (i.e. netapp.user and netapp.pass) in its AppliesTo logic when assigning a system category of NetApp to the host. Previously, this PropertySource used isNetApp which is SNMP reliant and therefore failed to identify NetApp hosts if SNMP was disabled.
- NetApp Cluster NFS – 1 DataSource
- Removed alert threshold for write_error datapoint as it was encompassing too wide of a range of errors; made minor changes to graphs.
- NetApp Cluster Status – 1 DataSource
- Fixed scripting issue causing the BrokenDisks datapoint to incorrectly enter alert condition.
- NetApp Cluster Volumes – 1 DataSource
- Fixed issue in collection script instance UUID to ensure capture of metrics from all instances.
- NetApp E-Series Troubleshooter – 1 DataSource
- Fixed issue in Active Discovery script and updated discovery interval; added alerting.
- Oracle [Blocked Sessions Overview | Blocked Sessions] – 2 DataSources
- Fixed typos causing script issues.
- RabbitMQ Queue Statistics – 1 DataSource
- Sanitized wildvalue to exclude invalid ASCII characters that were preventing it from parsing correctly; made various improvements to graphs and datapoints.
- Raritan Power Distribution [Inlets | Outlets]
- Fixed issue in collection script to properly scale power metric.
- Synology [RAID Status | Status] – 2 DataSources
- Made numerous improvements to graphs and datapoints.
- Topology mapping Updated PropertySources – 3 PropertySources
- Added support for Dell Force10S switches to the addCategory_TopoSwitch and addERI_Device PropertySources; fixed issue with improperly identified switch for addERI_Cisco PropertySource.
- Topology mapping Updated TopologySource – 1 TopologySource
- Added support to the Networking_L2_snmpSwitch for multi MAC interfaces/trunking, Dell Force10S switches, and CDP neighbor data from Catalyst 29XX switches; fixed issue with improperly identified switch; addressed other miscellaneous issues.
- Topology mapping VMware vCenter – 2 DataSources, 1 PropertySource
- Updated the VMware vCenter Host Performance and VMware vCenter Host Status DataSources, as well as the addERI_ESXi PropertySource, to block MAC ERI setting for Cisco UCS running VMware.
- VMware ESXi Datastore Capacity – 1 DataSource
- Updated the PercentUsed complex datapoint.
- VMware Troubleshooter – 1 DataSource
- Updated Active Discovery interval; added alerting.
- Windows Cluster Disk Partitions – 1 DataSource
- Fixed issue in graph datapoint; improved alert message.
- Win2k16 HyperV Virtual Machines – 1 DataSource
- Added status codes.
Other v.130 Enhancements
Alerting
- Old Alerts page UI retiring. In October of 2019, the new Alerts page launched with a temporary toggle that allowed navigation between the new and old UI. Access to this toggle (and therefore the old Alerts page) is now removed. Only the new Alerts page UI will remain accessible. The new Alerts page does not support Microsoft Internet Explorer 11. If you are using IE11, we strongly recommend that you move to a supported LogicMonitor browser as soon as possible to avoid any disruptions in platform functionality.
- Wrapped text in the alert table. By default, text now wraps in the Alert table found on the Alerts page. Previously, text wrapping was not an option. A new setting titled Enable Text Wrap is now available from the Alert Table Settings dialog that supports toggling between wrapped and truncated text display.
- Removal of time zone designation from alert table display. In the new Alerts page UI, time zone designation was displaying in the “Effective Threshold” column for alerts, regardless of whether the threshold had time-based considerations. Moving forward, time zone designation will only display for alerts in which the designation is relevant (i.e. alerts triggered by time-based thresholds). Note: Alerts generated by thresholds that have previously generated alerts will still include the time zone designation regardless of relevancy. If desired, you can manually edit/resave these thresholds to prevent time zone designation from displaying.
EventSources
- Alert testing permissions restricted. Users with read-only permissions were previously able to test alert routing for EventSource alerts from the Resources page. This has been fixed.
- Maximum value imposed for Clear After configuration. The Clear After configuration found on EventSource definitions is now limited to a maximum value of 5760 minutes (four days). This configuration is responsible for determining how long an EventSource’s alert remains active before auto clearing. EventSources will need to comply with this new limit in order to be successfully added or updated.
Reports
- Resource Metrics Trends report. A “sum” aggregation calculation is now available as an output value for the datapoint(s) included in the Resource Metrics Trends report. This is useful for reporting on the sum of a specific metric over a period of time.
REST API
- alertTransitionInterval and alertClearInterval settings available at DataSource level. When getting DataSourceInstanceAlert information via API, you can now see alertTransitionInterval and alertClearInterval settings configured at the DataSource level as read only values. Previously, these values were always displayed as “-1” at the instance level via API.
SAML
- Permission restrictions for SAML users. SAML users are no longer able to edit username and email fields to enforce use of data populated by SAML/SSO during provisioning. In addition, SAML users are no longer able to perform password resets.
Tokens
- ##WILDVALUE##. The ##WILDVALUE## token now resolves to instance value. Previously it was resolving, incorrectly, to instance name.
Looking Ahead: Integrations Page
As part of LogicMonitor’s ongoing UI initiative, we’ll soon be launching a brand new interface for the management of LogicModules. This new interface, called the Integrations page, will provide a centralized view into all LogicModule integrations (e.g. DataSources, PropertySources, EventSources, etc.) that are available for use in your monitoring activities.
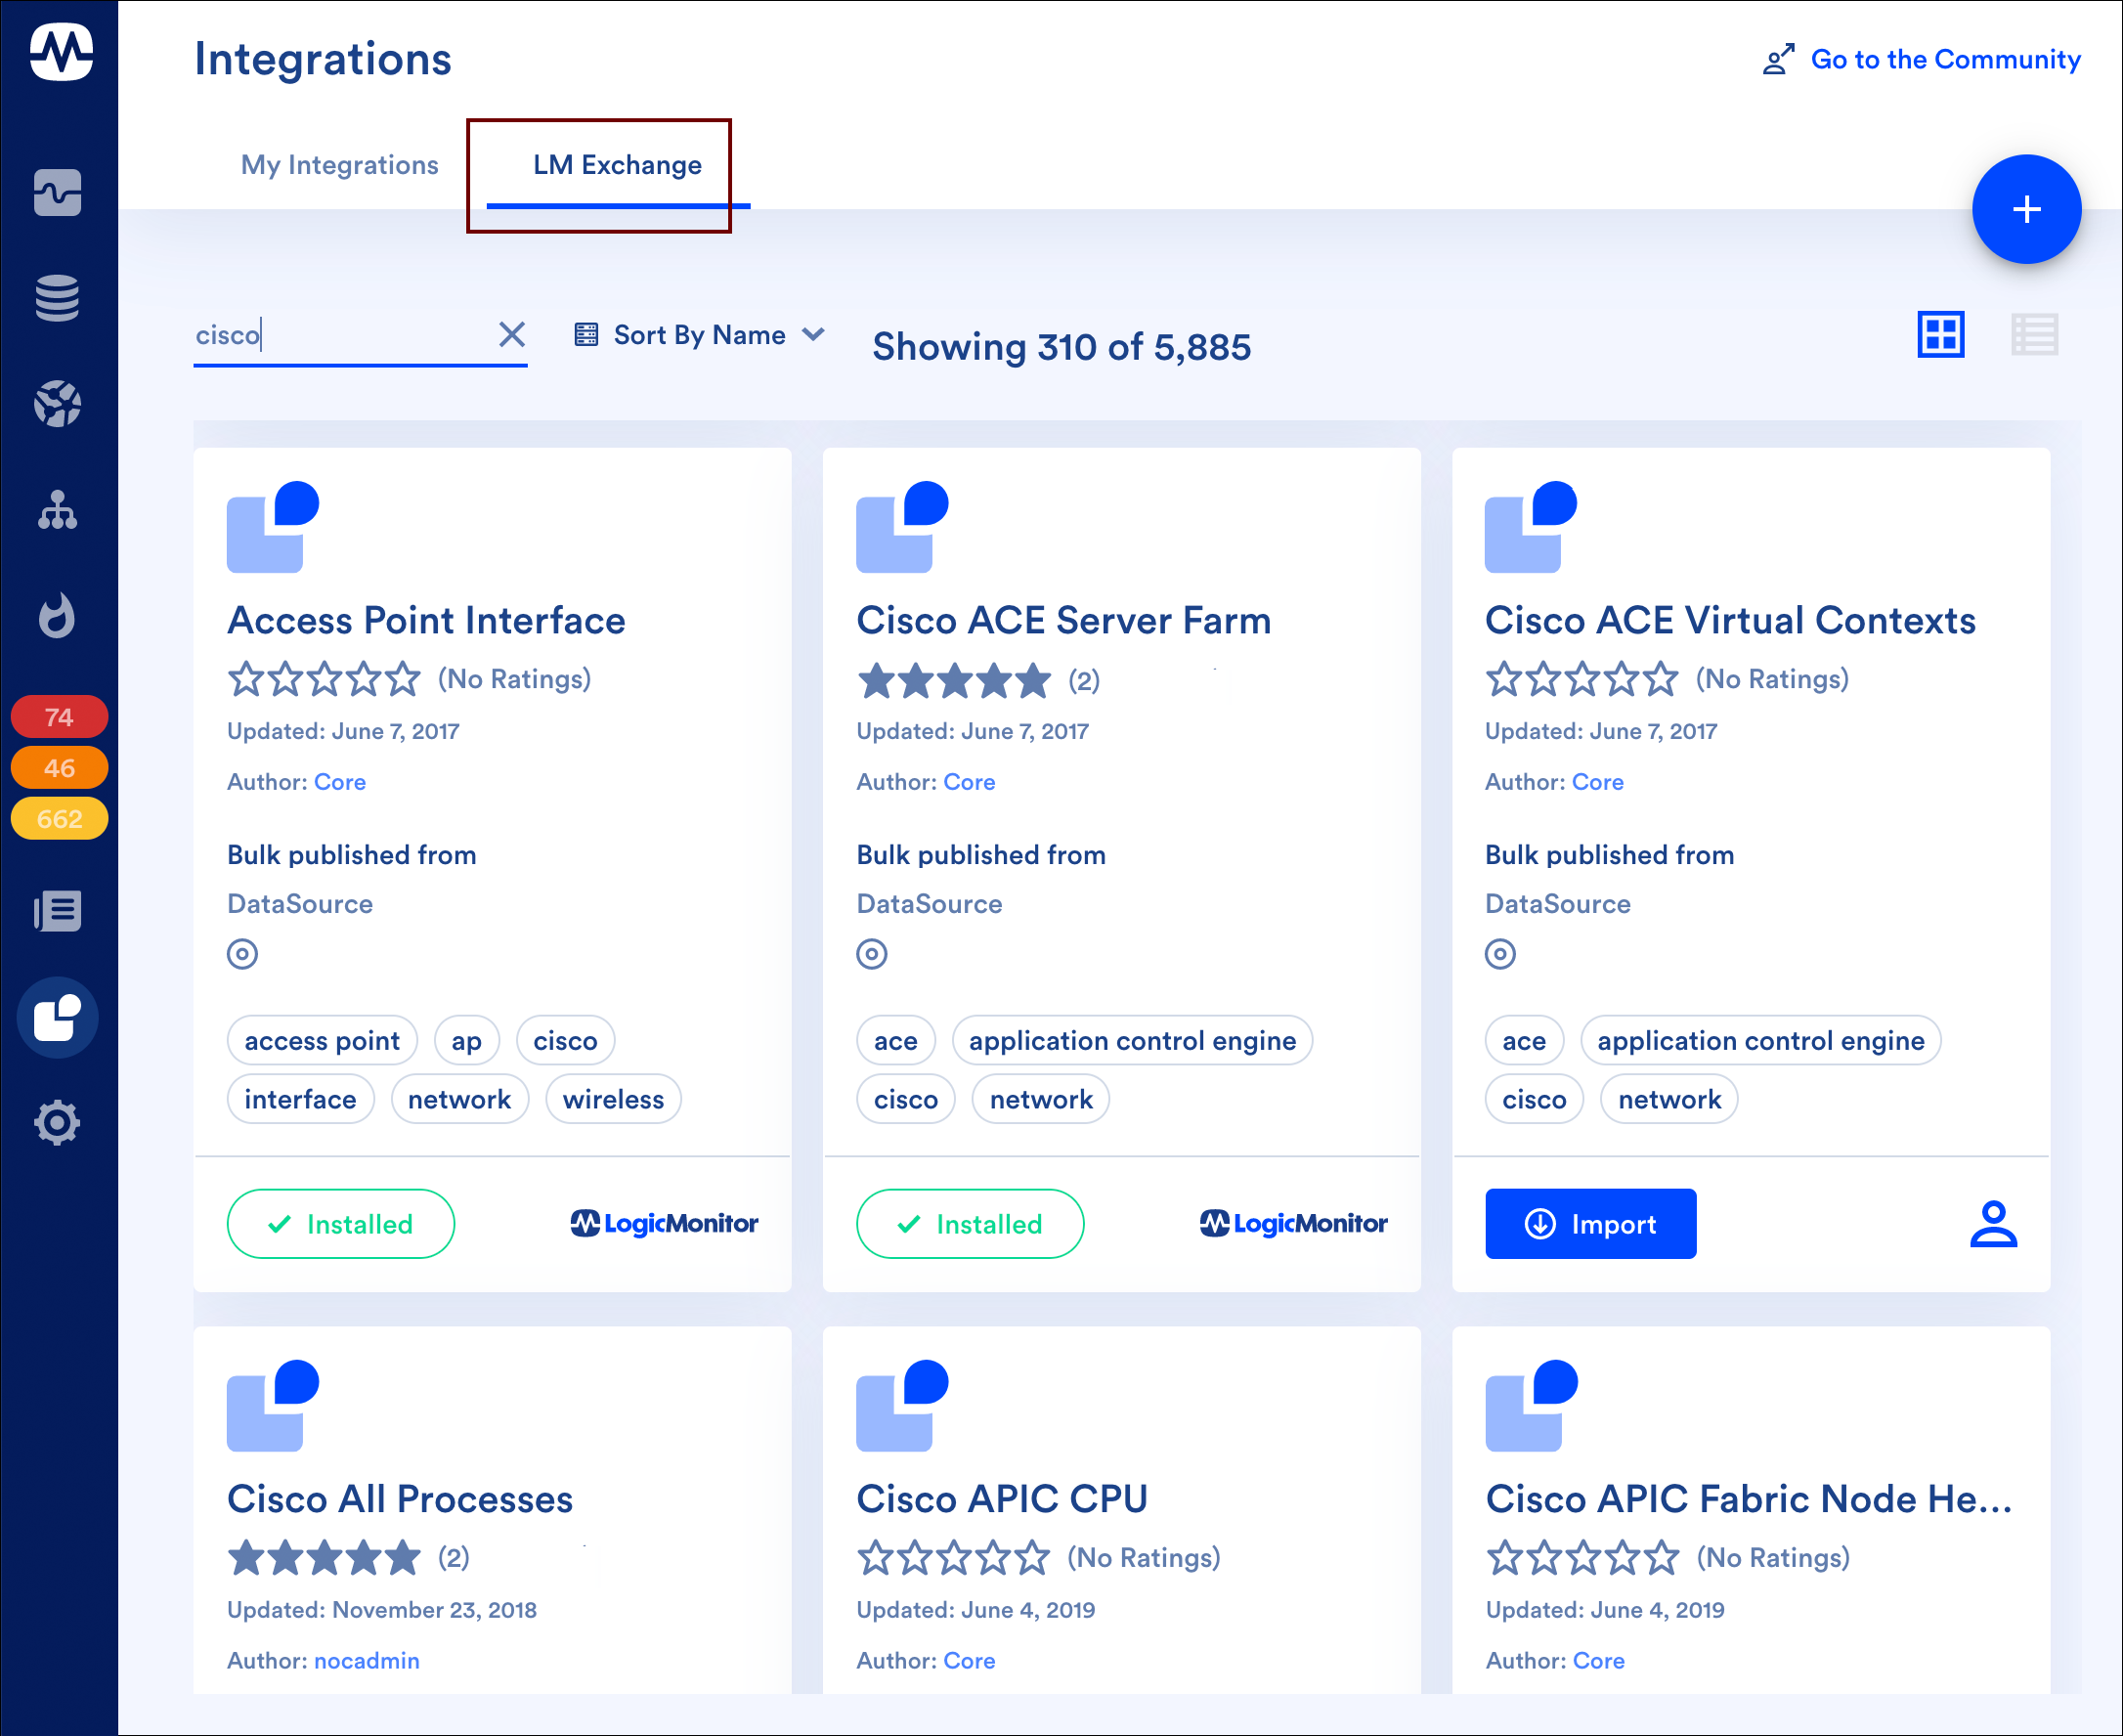
▲ The new Integrations page brings the LogicMonitor repository right into the platform. Using the LM Exchange tab, you can easily browse, search, and import new and updated LogicModules—whether published by LogicMonitor or by a member of the LogicMonitor user community. (UI image captured from alpha version; subject to change.)